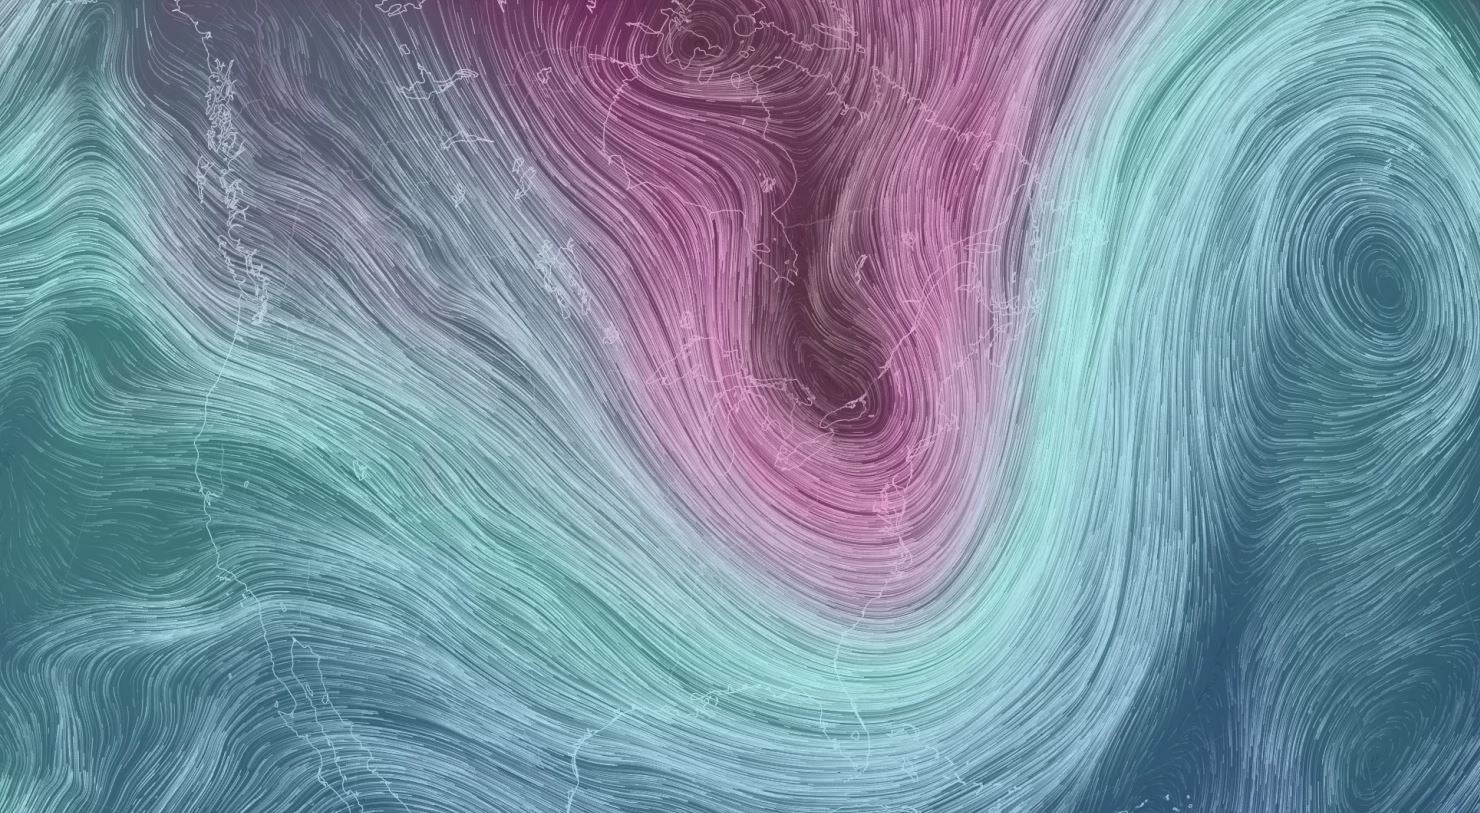
Designed by Cameron Beccario, the map uses real-time data provided by the government to show how and where the wind moves, colour-coding the temperatures it brings with it.
As you can see, the super cold purple air usually the preserve of the Arctic is being dragged further and further south by the polar vortex cyclone just north-east of the American east coast.
These Arctic winds, which are hitting Canada even worse that the States, can be traced all the way back to Siberia.
A 'polar vortex' of frigid air centered on the North Pole has dropped temperatures to the negative double digits
For Florida, the National Weather Service has warned that the freeze on its way "will kill crops and other sensitive vegetation".
The last time cold like this was reported was decades ago, and in some places - like Cleveland - it goes back more than a century.
US winter weather
Show all 30
What's even stranger is that as the US east has been plunged into a winter of Game of Thrones proportions, the west coast is experiencing an abnormally warm season.
Join our commenting forum
Join thought-provoking conversations, follow other Independent readers and see their replies

Join our commenting forum
Join thought-provoking conversations, follow other Independent readers and see their replies