Autumn Statement: The one chart that shows how the incomes of the 'Jams' will be crushed over 5 years
The inflation-adjusted incomes of the entire bottom third of the income distribution - the least well-off thirty per cent of households - is projected to fall between 2015 and 2020

For free real time breaking news alerts sent straight to your inbox sign up to our breaking news emails
Sign up to our free breaking news emails
The Autumn Statement not only offers little help to the "Just About Managing" classes, but their overall incomes are set to be squeezed even more severely over the course of this Parliament than previously thought thanks to Brexit, a new analysis by the Resolution Foundation think tank has found.
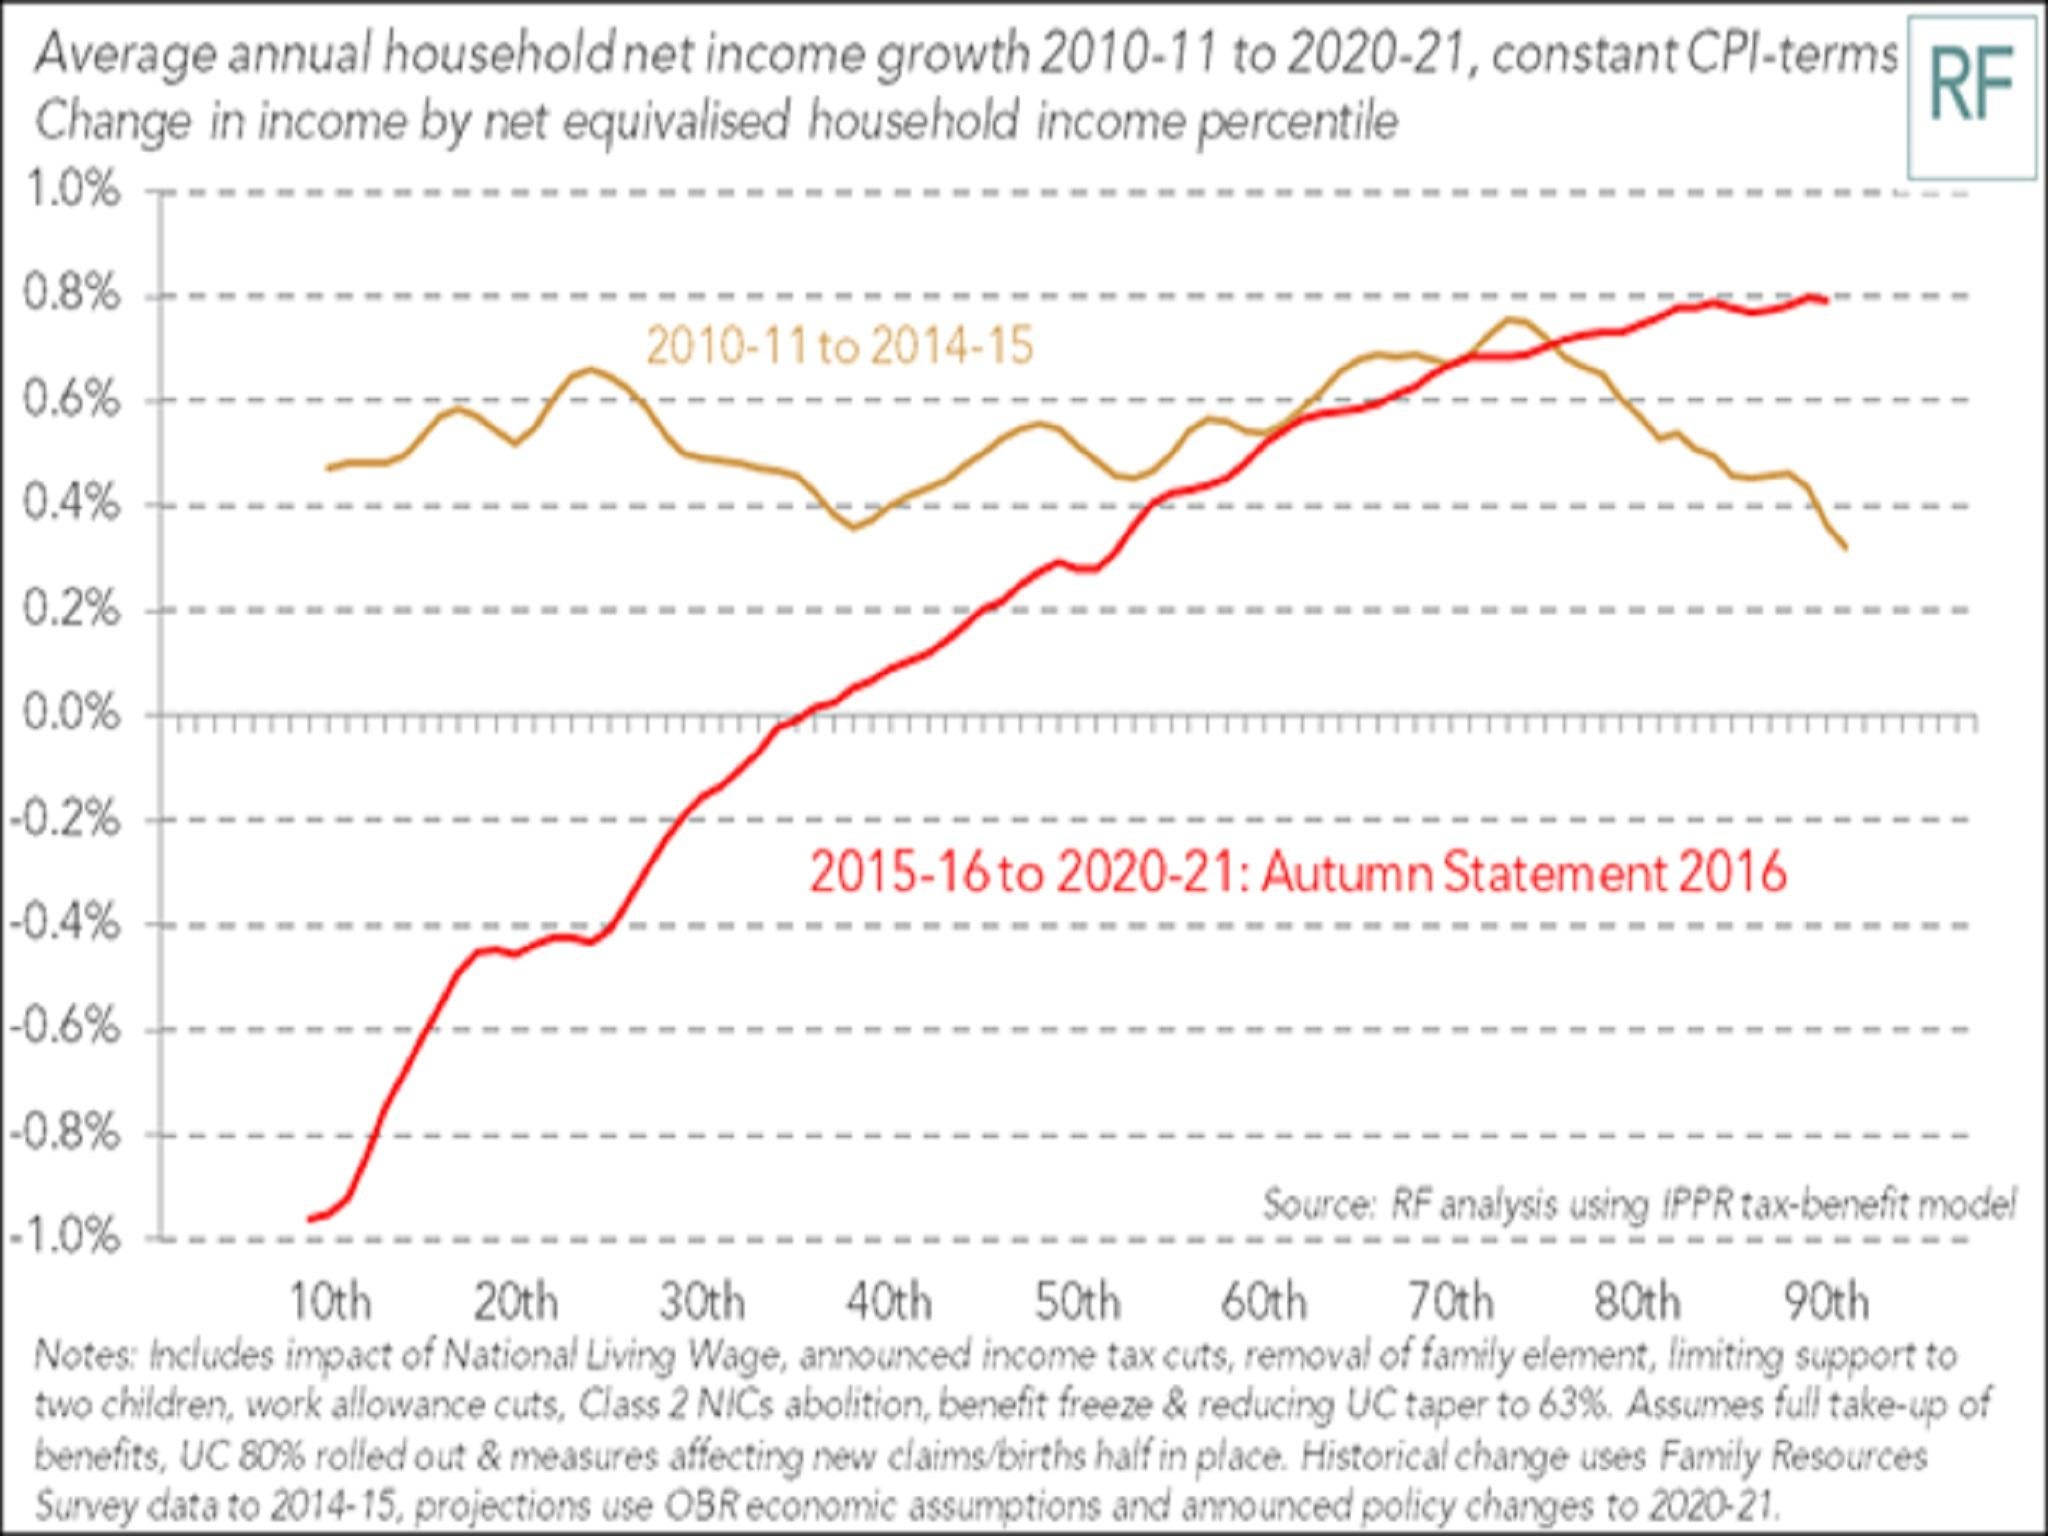
Using the latest average earnings and inflation forecasts from the Office for Budget Responsibilty, Resolution calculates that the inflation-adjusted incomes of the entire bottom third of the income distribution - the least well-off thirty per cent of households - will fall between 2015 and 2020.
This contrasts with the previous parliament when inflation-adjusted incomes of the bottom third actually saw modest growth of around 0.5 per cent.
An even bigger squeeze for the Jams...
And Brexit and the Autumn Statement are responsible for making their plight worse, not better.
The blue line in the chart below shows that the incomes of the bottom quarter of households were already set to see their incomes fall in this parliament mainly due to George Osborne's £12bn post-2015 election squeeze on working age welfare and tax credit benefits.
But despite Theresa May's pledges to focus on the "Jams" in the middle and lower-middle income category her government is proceeding with the vast majority of those cuts.
And weak wages and higher inflation due to a combination of Brexit and the slump in sterling since the 23 June referendum means that the position of this group (shown by the red line) is now even worse.
Little help from Theresa May...
And rather than a quarter of households facing real income falls, the share facing a decline rises to a third.
The median average household is facing a rise of just 0.2 per cent over the parliament, down from 0.5 per cent at the time of the March Budget.
The gold line shows income growth across the income distribution in the last parliament, with all households seeing some modest overall growth despite the historically slow economic recovery from the banking crisis.
In the end, wealthier households actually saw slower real terms income growth between 2010 and 2015,
"The combination of lower growth, higher inflation and the government's decision to press ahead with big welfare cuts, means that households risk experiencing even slower income growth in this parliament than they saw in the aftermath of the financial crisis. But unlike the last parliament, it will be low and middle income households who feel the tightest squeeze this time round," said Torsten Bell, director of the Resolution Foundation.
Resolution also esimates that the real average weekly earnings growth between 2010 and 2020 is set to be the weakest decade since the 1900s.
Real average wages are projected to grow by just 1.6 per cent over the 10 years.
In the 2000s they grew by 12.7 per cent and by over 20 per cent in every other decade since the 1920s.
Subscribe to Independent Premium to bookmark this article
Want to bookmark your favourite articles and stories to read or reference later? Start your Independent Premium subscription today.
Join our commenting forum
Join thought-provoking conversations, follow other Independent readers and see their replies