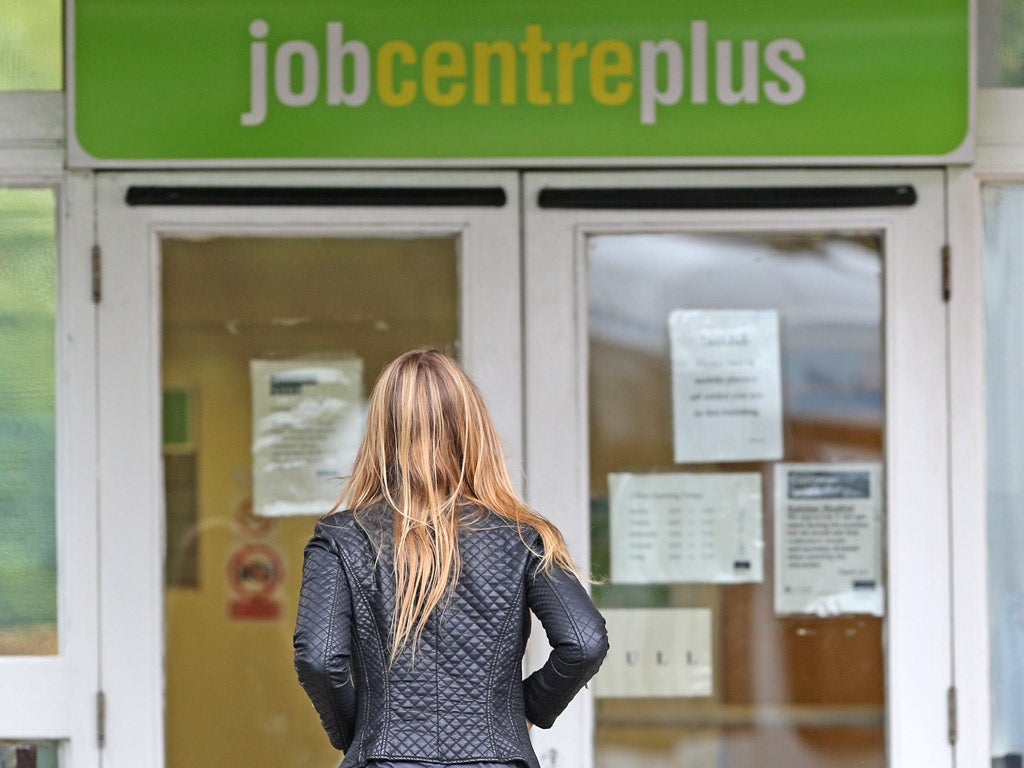
This is what 5.4% unemployment really means
What do the unemployment figures actually mean?

For free real time breaking news alerts sent straight to your inbox sign up to our breaking news emails
Sign up to our free breaking news emails
Unemployment figures were released on Wednesday showing that the UK unemployment rate has fallen to 5.4 per cent in the three months to August.
The number of people out of work was 1.77 million between June and August, down 79,000 from the previous quarter.
It was the lowest jobless rate since the second quarter of 2008 according the Office for National Statistics said.
Who is classed as unemployed?
A person is classed as unemployed if not only out of work, but also actively looking for work and available to start work within a fortnight.
Today’s numbers are great! Is there a margin of error?
The Office for National Statistics is 95 per cent sure that the figure is right within plus or minus 81,000.
How are these figures actually collected?
The unemployment figures are based on the Labour Force Survey (LFS), which is a huge survey in which the ONS talks to about 40,000 households or 100,000 individuals.
A new survey is done every month, but comparisons are made between separate three-month periods, not overlapping ones. e.g. April-June vs. Jan-March, not April-June vs. March-May.
Why could the figures be misleading?
The figures are collected on a rolling basis. People from the LFS are allocated areas in which they conduct the survey and collect the data from households over the 13 weeks of the quarter.
So when a month's figures come out, one third of the respondents will have responded since the last figures were released, but two thirds of respondents will still be using the answers they gave for the previous month.
I see, so does that lead to errors?
Yes some people misinterpret the data. For instance last February the ONS reported that the unemployment rate for October to December was 7.2 per cent. This lead to the media reporting it as an unexpected rise from the previous 7.1 per cent figure.
However, the figures were comparable not with the previous month's figure but the one for the previous quarter, July to September, which was 7.6 per cent.
This meant the unemployment rate had actually fallen.
Would it be more sensible to report it once a quarter instead of every month?
Unemployment was indeed reported once a quarter up until the late 1990s. But then it was realised that the figures could be released monthly without collecting more data.
If the ONS only published figures once a quarter they would not be more accurate than the monthly ones, it would just prevent people comparing the wrong figures. The key is the right interpretation of these numbers.
Would it be possible to reduce the margin of error?
Technically yes but it would also be “eye-wateringly” expensive according to the BBC. Doubling the number of households surveyed would make the change in unemployment correct to plus or minus about 55,000 instead of 80,000.
Subscribe to Independent Premium to bookmark this article
Want to bookmark your favourite articles and stories to read or reference later? Start your Independent Premium subscription today.
Join our commenting forum
Join thought-provoking conversations, follow other Independent readers and see their replies