NUKEMAP: The man behind the Google Maps mash-up which shows what a nuclear bomb can do
How afraid should you be of the H-bomb? A Google Maps mash-up, NUKEMAP, lets you see for yourself – from a safe distance. Mark Piesing hits the button
It's hard to escape the feeling that I've been given a glimpse of our post-apocalyptic future.
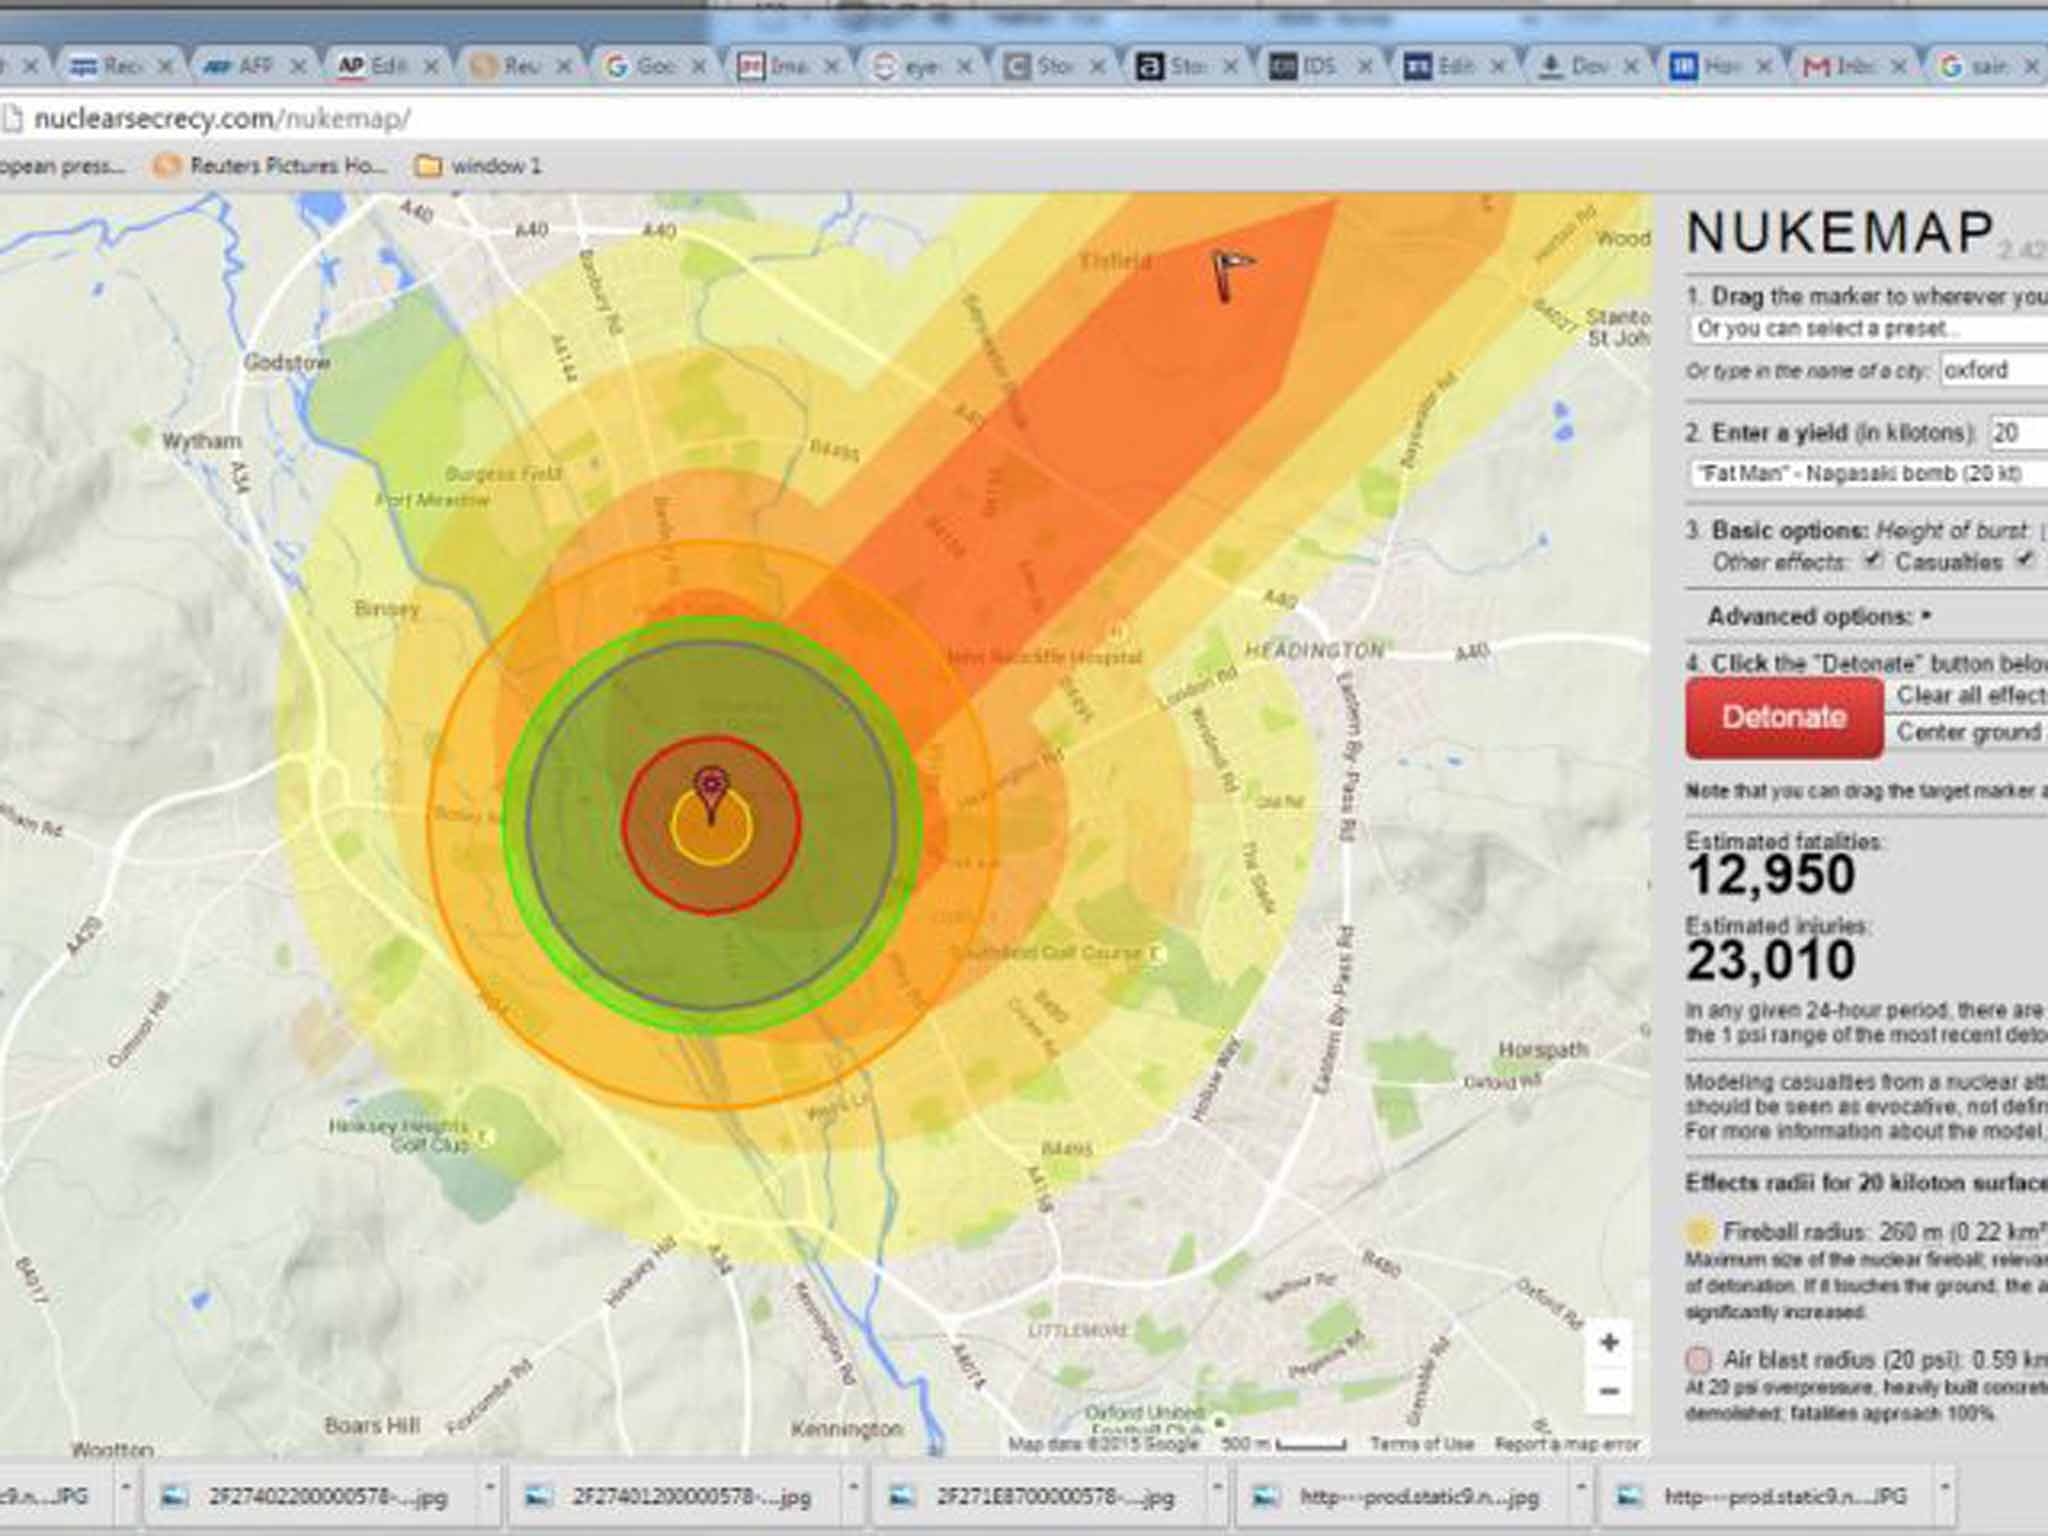
I'd typed “Oxford” into the text box, picked my ground zero (Lloyds Bank – don't ask me why) and my choice of 30 virtual nuclear weapons, clicked on the big red DETONATE button and then watched as a dark stain spread across the Google map towards my favourite pub and my home only 15 minutes' walk from the city centre. While the pub is hit by a wave of thermal radiation that causes third-degree burns, my house just survives, as do – rather surprisingly – the leafy Victorian suburbs of Summertown, and industrial Cowley, home of the Mini. The casualty figures spin round like a roulette wheel before stopping at 15,430 fatalities and 24,000 injured, out of a population of about 160,000.
This is the hit Google Maps mash-up that calculates the effects of the detonation of a nuclear bomb on a town or city of your choice. It was designed by nuclear historian Alex Wellerstein, Assistant Professor for Science and Technology Studies at the Stevens Institute of Technology in New Jersey and author of the nuclear secrecy blog Restricted Data, to help to fill in the information gap about nuclear weapons that he believes opened up after the end of the Cold War. Since it was launched in 2012, more than two million people have visited the site – 250,000 of those solely on the anniversary of the first nuclear bomb on Hiroshima. Now, around 25,000 people a day are seeing a radioactive version of the future.
The first virtual bomb I chose – from a drop-down list of real-life bombs including two likely sizes of terrorist bombs – was the 20 kiloton Gadget, about a third larger than the bomb dropped on Hiroshima and the same size as that dropped on Nagasaki a few days later. My second bomb was something at the opposite extreme, the much more powerful 20 megaton Ivy Mike, the world's first hydrogen bomb. The largest nuclear bomb ever exploded was the 50 megaton Tsar Bomba, with 10 times the combined energy of all the conventional explosives used in the Second World War.
Again I clicked “detonate” on the map, and this time an “oh my God” escaped my lips as most of Oxfordshire disappeared under the shaded concentric rings that show the differing effects of the explosion. This time my house and most of Oxford falls within the range of the fireball – Henley-on-Thames only just escapes the thermal radiation. The fatalities of this explosion run to 213,000 and the injuries at 126,000. Light wind then spreads lethal radiation to King's Lynn and Wells-next-the-Sea, where we go on holiday with the kids, and out into the North Sea. The same sized explosion in London leaves 2.4 million dead and 2.6 million wounded. No wonder people thought that the only purpose of the H-bomb was to commit genocide.
“When my students see that the first H-bomb destroys the whole metro region and there are millions of casualties, I get an involuntary audible gasp and I know I am hitting them right in the guts,” says Wellerstein. “Students today have almost no conception of what nuclear weapons are or what they can do, so I created the NUKEMAP to help them calibrate their fear so they can work out just how afraid we should be of things like the North Korean bomb or even an Isis nuclear weapon.”
NUKEMAP is based on pen-and-paper mathematical models distributed by the US government in the 1960s and 1970s to help people understand the bomb. Of these, Wellerstein chose one that was accurate, fast and compatible with a web browser and Google Maps, and that didn't overwhelm the user with data. He also wanted something that could be used in, say, Tehran as well as Washington. As a result he had to use an idealised model rather than the most accurate model, which would depend on – for example – constantly updated weather data. At the moment, the programme can also only model the result of one nuclear explosion at a time rather than the multiple explosions that would result in the real world from an escalating nuclear crisis or an all-out attack.
“Of course it doesn't facilitate terrorism because if you get to the stage that the only thing a terrorist needs is the NUKEMAP then things have gone too far already,” says Wellerstein. “It is not hard to work out the key targets in most countries if you just want to kill a lot of people.”
Wellerstein says NUKEMAP has become a tool for journalists, teachers and even arguing friends. There are exciting new upgrades in the pipeline, but he stresses: “I don't want people to think nuclear war is survivable or means instant death. I want people to see them [bombs] as pieces of technology made out of bolts and wires put together by human beings who can decide how they are used.”
Join our commenting forum
Join thought-provoking conversations, follow other Independent readers and see their replies
Comments
Bookmark popover
Removed from bookmarks