Why pioneering oceanographer Marie Tharp deserves to be remembered as one of science’s greats
Marie Tharp’s topographical maps helped to revolutionise our understanding of the sea floor. With the 100th anniversary of her birth, geoscientists are still building on her work, writes Suzanne O’Connell

Sign up for the Independent Women email for the latest news, opinion and features
Get the Independent Women email for free
Despite all the deep-sea expeditions and samples taken from the seabed over the past 100 years, humans still know very little about the ocean’s deepest reaches. And there are good reasons to learn more.
Most tsunamis start with earthquakes under or near the ocean floor. The bottom of the ocean provides a habitat for fish, corals and complex communities of microbes, crustaceans and other organisms. Its topography controls currents that distribute heat, helping to regulate Earth’s climate.
Last month marked the 100th anniversary of the birth of Marie Tharp, a geologist and oceanographer who created maps that changed the way people imagine two-thirds of the world. Beginning in 1957, Tharp and her research partner, Bruce Heezen, began publishing the first comprehensive maps that showed the main features of the ocean bottom – mountains, valleys and trenches.
As a geoscientist, I believe Tharp should be as famous as Jane Goodall or Neil Armstrong. Here’s why.
Well into the 1950s, many scientists assumed that the seabed was featureless. Tharp showed that it contained rugged terrain, and that much of it was laid out in a systematic way.
Her images were critical to the development of plate tectonic theory – the idea that plates, or large sections of Earth’s crust, interact to generate the planet’s seismic and volcanic activity. Earlier researchers – particularly Alfred Wegener – noticed how well the coastlines of Africa and South America fit together and proposed that the continents had once been connected; Tharp identified mountains and a rift valley in the centre of the Atlantic Ocean where the two continents could have been ripped apart.
Thanks to Tharp’s hand-drawn renditions of the ocean floor, I can imagine a walk across the Atlantic Ocean bottom from New York City to Lisbon. The journey would take me out along the continental shelf. Then downward towards the Sohm Abyssal Plain. I’d need to detour around underwater mountains, called seamounts. Then I’d start a slow climb up the Mid-Atlantic Ridge, a submerged north-south mountain range.
One of her important innovations was creating sketches depicting what the sea floor would look like. These views made it easier to visualise the ocean floor’s topography
After ascending to around 8,200 feet (2,500 metres) below sea level to the ridge’s peak, I would descend several hundred feet, cross the ridge’s central rift valley and proceed up over the ridge’s eastern edge. Then back down to the ocean floor, until I began trekking up the European continental slope to Lisbon. The total walk would be about 3,800 miles (6,000km) – almost twice the length of the Appalachian Trail.
Born in Ypsilanti, Michigan, Tharp studied English and music in college. But then in 1943 she enrolled in a University of Michigan master’s degree programme designed to train women to be petroleum geologists during the Second World War. “Girls were needed to fill the jobs left open because the guys were off fighting,” Tharp later recalled.
After working for an oil company in Oklahoma, Tharp sought a geology job at Columbia University in 1948. Women couldn’t go on research ships, but Tharp could draft, and was hired to assist male graduate students.
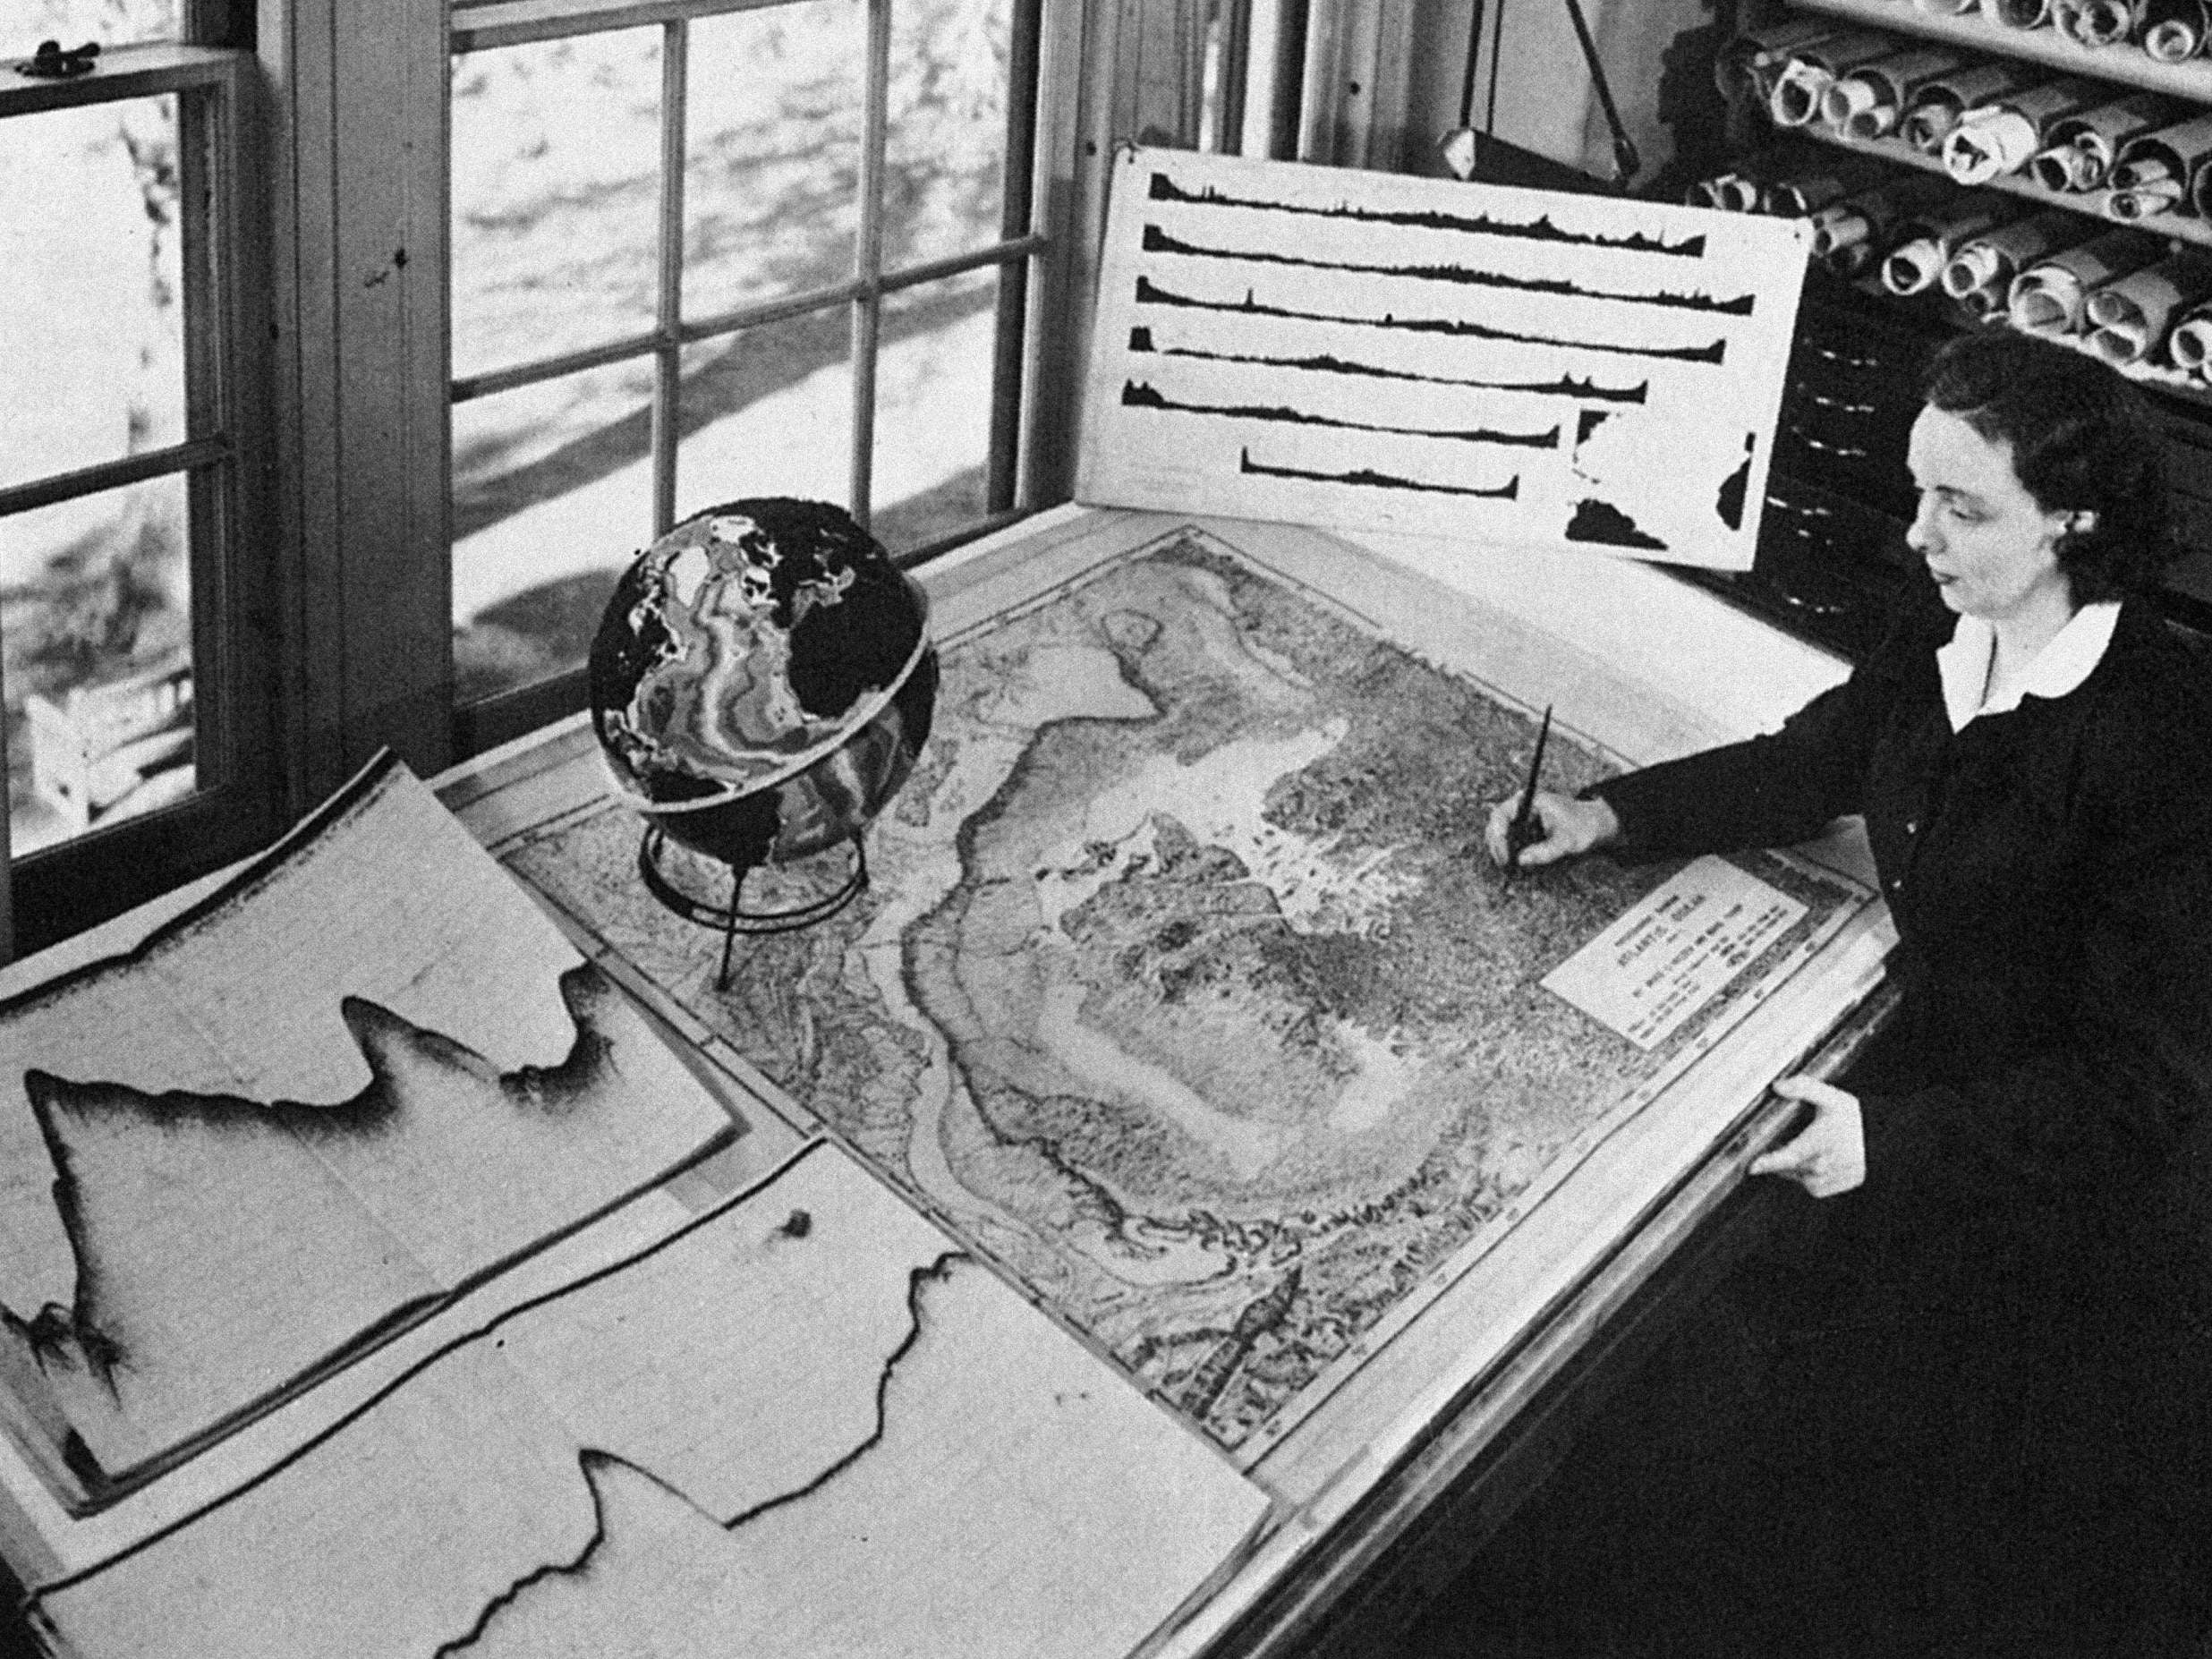
Tharp worked with Bruce Heezen, a grad student who gave her sea-floor profiles to draft. These are long paper rolls that show the depth of the sea floor along a linear path, measured from a ship using sonar.
Starting with a large blank sheet of paper, Tharp marked lines of latitude and longitude. Then she’d carefully mark where the ship had travelled. Next she’d read the depth at each location from the sonar profile, mark it on the ship’s track and create her own condensed profile, showing the depth to the ocean floor versus the distance the ship had travelled.
One of her important innovations was creating sketches depicting what the sea floor would look like. These views made it easier to visualise the ocean floor’s topography and create a physiographic map.
Tharp’s careful plotting of six east-to-west profiles across the north Atlantic revealed something no one had ever described before: a cleft in the centre of the ocean, miles wide and hundreds of feet deep. Tharp suggested that it was a rift valley – a type of long trough that was known to exist on land.
Heezen called this idea “girl talk” and told Tharp to recalculate and redraft. When she did, the rift valley was still there.
Because ships move slowly, it would take one ship 200 years to completely map the sea floor. An international effort to map the entire ocean floor in detail by 2030 is under way
Another research assistant was plotting locations of earthquake epicentres on a map of the same size and scale. Comparing the two maps, Heezen and Tharp realised that the earthquake epicentres fell inside the rift valley. This discovery was critical to the development of plate tectonic theory: it suggested that movement was occurring in the rift valley, and that the continents might actually be drifting apart.
This insight was revolutionary. When Heezen, as a newly minted PhD, gave a talk at Princeton in 1957 and showed the rift valley and epicentres, the geology department’s chair, Harry Hess, said: “You have shaken the foundations of geology.”
In 1959, the Geological Society of America published “The Floors of the Oceans: I. The North Atlantic” by Heezen, Tharp and “Doc” Ewing, director of the Lamont Observatory, where they worked. It contained Tharp’s ocean profiles, ideas and access to Tharp’s physiographic maps.
Some scientists thought the work was brilliant, but most didn’t believe it. French undersea explorer Jacques Cousteau was determined to prove Tharp wrong. Sailing aboard his research vessel, the Calypso, he purposely crossed the Mid-Atlantic Ridge and lowered an underwater movie camera. To Cousteau’s surprise, the film showed that a rift valley existed.
“There’s truth to the old cliche that a picture is worth a thousand words and that seeing is believing,” Tharp observed in a retrospective essay in 1999.
What could have created the rift? Princeton’s Hess proposed some ideas in a 1962 paper. It postulated that hot magma rose from inside the Earth at the rift, expanded as it cooled, and pushed two adjoining plates further apart. This idea was a key contribution to plate tectonic theory, but Hess failed to reference the critical work presented in “The Floors of the Oceans” – one of the few publications that included Tharp as a co-author.
Tharp continued working with Heezen to bring the ocean floor to life. Their collaboration included an Indian Ocean map, published by National Geographic in 1967, and a 1977 world ocean floor map that is now held at the Library of Congress.
After Heezen died in 1977, Tharp continued her work until her death in 2006. In October 1978, Heezen (posthumously) and Tharp were awarded the Hubbard Medal, the National Geographic Society’s highest honour, joining the ranks of explorers and discoverers such as Ernest Shackleton, Louis and Mary Leakey and Jane Goodall.
Today, ships use a method called swath mapping, which measures depth over a ribbon-like path rather than along a single line. The ribbons can be stitched together to create an accurate sea-floor map.
But because ships move slowly, it would take one ship 200 years to completely map the sea floor. An international effort to map the entire ocean floor in detail by 2030 is under way, using multiple ships, led by the Nippon Foundation and the General Bathymetric Chart of the Oceans.
This information is critical to beginning to understand what the sea floor looks like on a neighbourhood scale. Marie Tharp was the first person to show the rich topography of the ocean floor and its different neighbourhoods.
Suzanne O’Connell is a professor of earth and environmental sciences at Wesleyan University. This article first appeared on The Conversation.
Subscribe to Independent Premium to bookmark this article
Want to bookmark your favourite articles and stories to read or reference later? Start your Independent Premium subscription today.
Join our commenting forum
Join thought-provoking conversations, follow other Independent readers and see their replies