Financial crisis 10 years on: Who are the winners and losers?
It’s a decade since the financial crash, but we're still paying the price

For free real time breaking news alerts sent straight to your inbox sign up to our breaking news emails
Sign up to our free breaking news emails
The memory still haunts many.
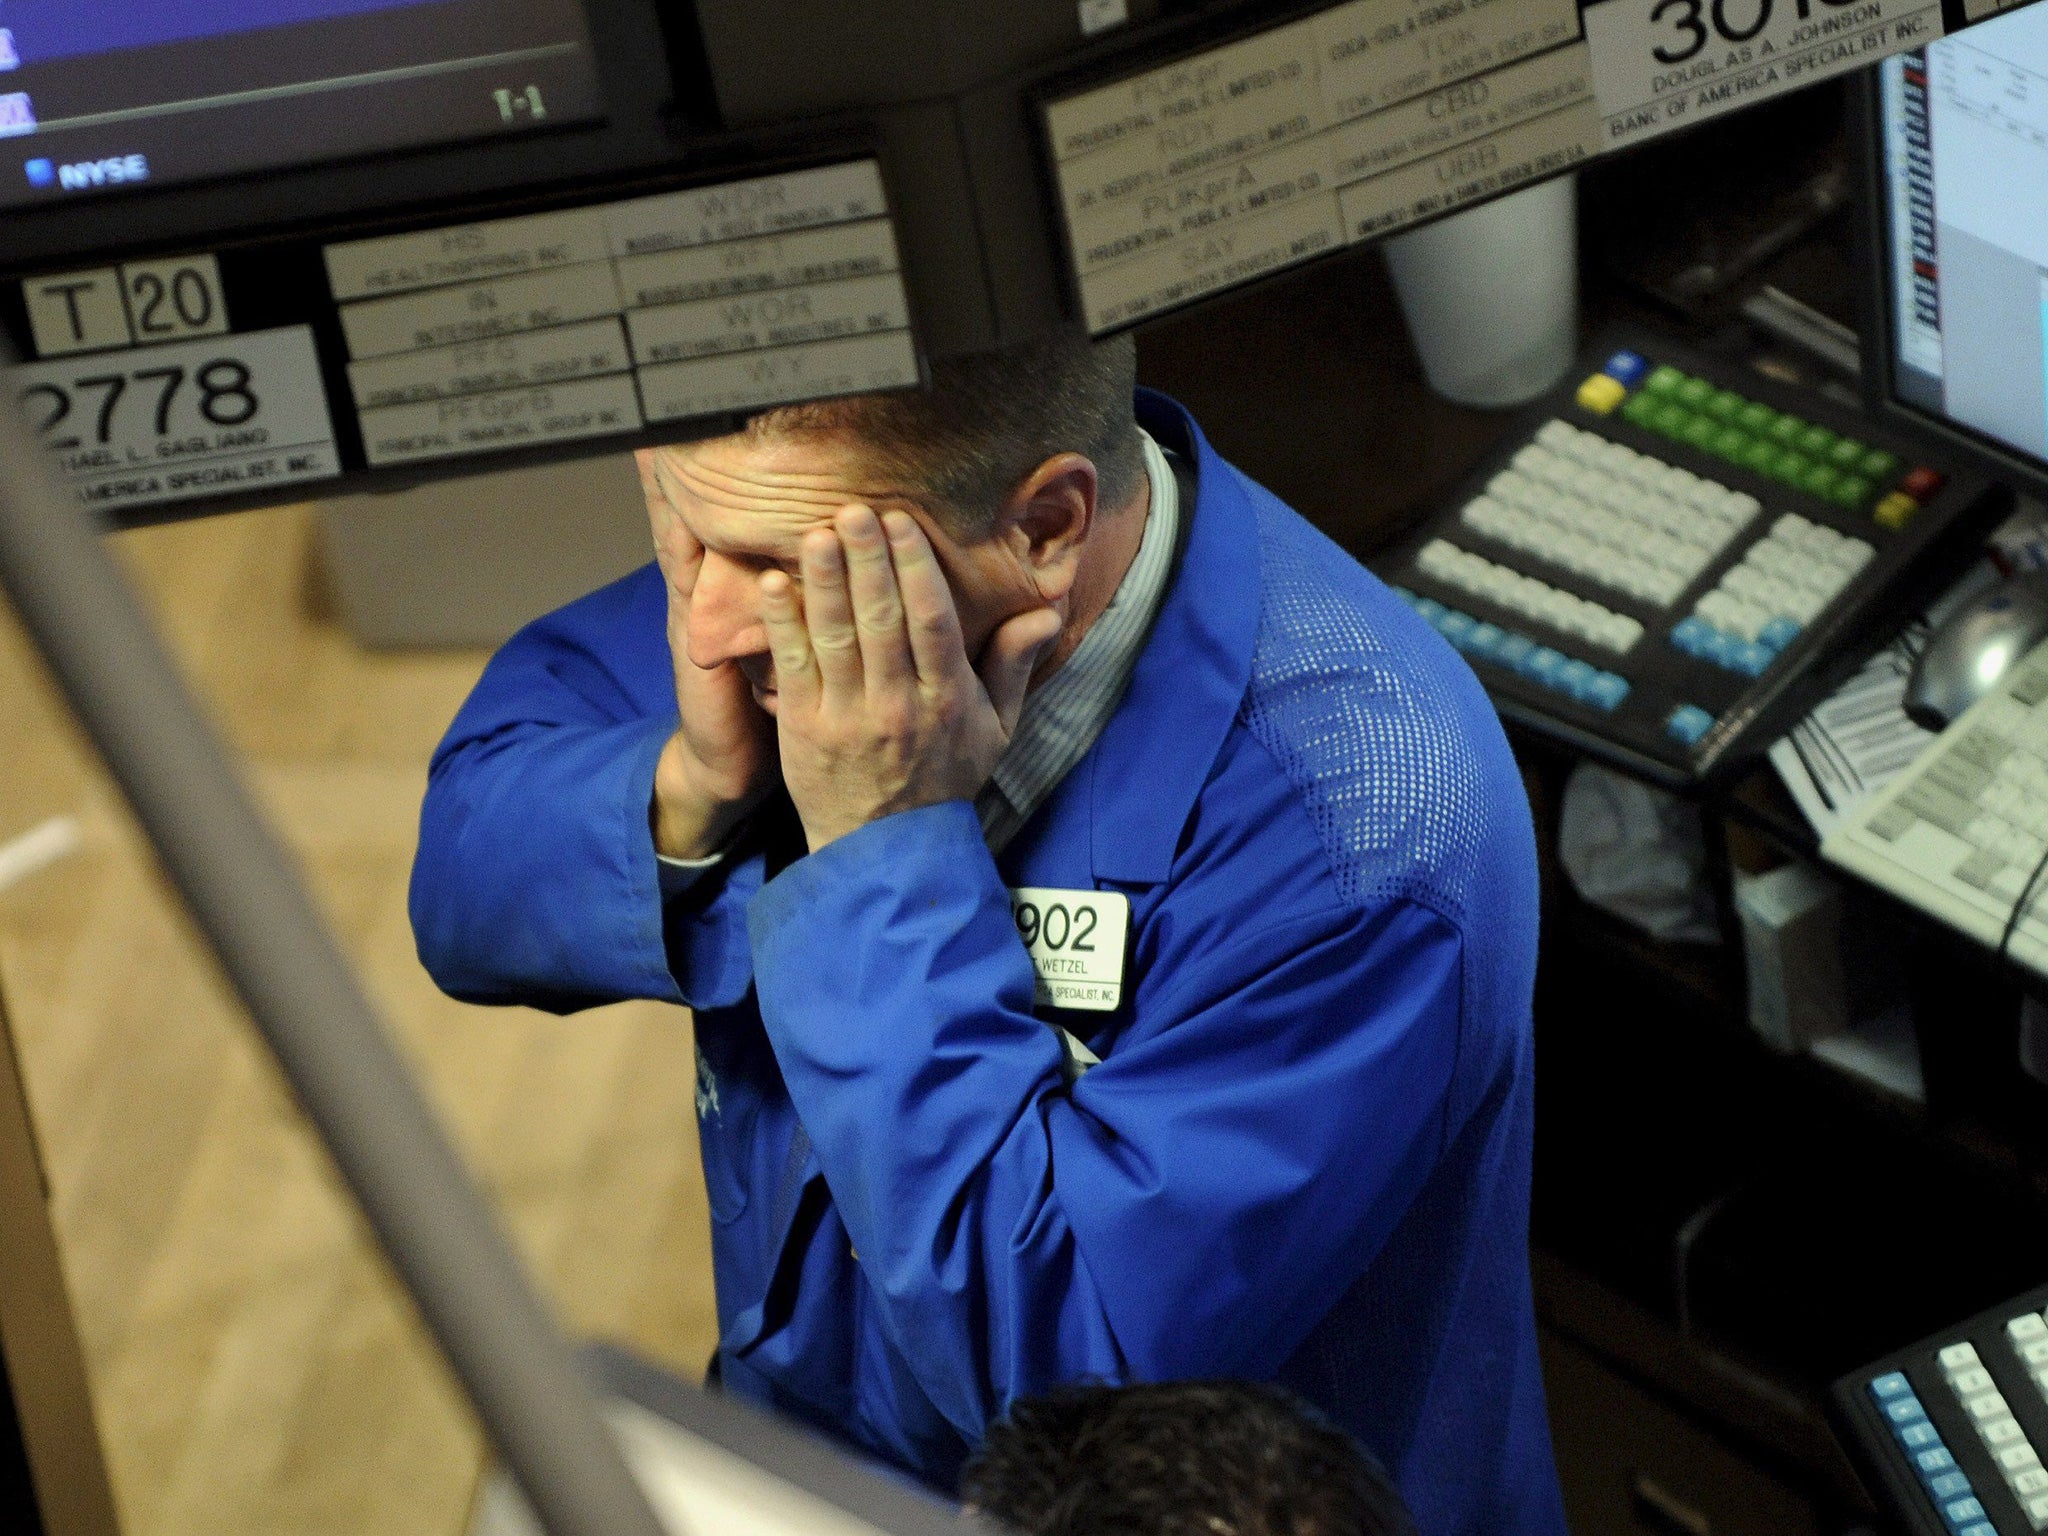
Facing an incredible $619bn in debt, Lehman Brothers filed for bankruptcy on 15 September 2008.
The largest failure in history, it was a defining moment in a global financial crash that was already making its presence felt around the world.
On that early autumn day we watched, mesmerised, as the company’s now ex-employees scurried from deceptively robust office buildings clutching the flimsiest of cardboard boxes.
Few of us realised then that we were witnessing the epicentre of an economic earthquake whose rubble still threatens to bury us a decade later.
As the tenth anniversary of that surreal day rolls around, experts across the financial and business industry have been trying to wrestle hard facts and objective measures from the subjective, politically and socially fraught history of the last ten years.
“The financial crisis ... was followed by the deepest recession experienced in the UK, and much of the western world, since the Second World War,” note Jonathan Cribb and Paul Johnson of renowned think tank the Institute for Fiscal Studies in a study of the financial fallout so far.
“What has proved most remarkable about the crisis and recession though was not its initial scale but the persistence of its effects. We had got used to the economy, and with it the public finances and household incomes, bouncing back strongly following previous downturns. That has not happened this time.”
So here’s how the financial crisis has, and continues, to affect you.
Income
The nation’s income, measured by GDP, is just 11 per cent higher today than it was at its pre-crisis peak in 2007-08. That means the economy is 16 per cent, or £300bn, smaller than it was projected to have been had it followed it pre-crisis trend.
Why does that matter to you or I? Because the yawning gap is mostly due to dreadful productivity levels, and that hits people in the payslip.
Average real earnings – adjusted to take inflation into account – for employees are 3 per cent below where they were in 2008. But that’s not consistent across different generations.
For those in the twenties or thirties, earnings in 2017 were 5 per cent and 7 per cent lower than in 2008 respectively, while for those aged 60 and over, including those whose income is from their pension, earnings were only 1 per cent lower than in 2008.
“The widening gulf between generations is partly due to government decisions to maintain the triple-lock on pensions, while also bringing in much higher tuition fees,” says Laura Suter, personal finance analyst at investment platform AJ Bell.
“What is also alarming to note in the 10 years since the financial crash is the sheer level of debt people of all ages have taken on.
“Low interest rates and relatively easy access to debt mean that households are now, on average, spending more than they earn for the first time since 1988.
“Even in the run up to the financial crisis, with the era of 100 per cent or more mortgages, debt in households was not higher.
“This is coupled with a decline in the amount people are saving, in part due to the low interest rates on offer and in part due to wages failing to keep up with the cost of living, driving more to raid their savings for everyday living.”
In fact, one group – The 10 Years On campaign – has used government data to estimate that the average UK household has missed out by more than £23,000 in disposable income in real terms since the crash. That works out at around £80 a week every week since this time ten years ago.
Property
If there’s a plus side to all this, it’s the cost of borrowing. Today’s mortgage market has significantly improved for borrowers, with tracker rates starting from 0.57 per cent above the Base Rate.
Before the collapse, the top two-year fixed rate mortgages were usually around 5.5 per cent. Today they start below 1.5 per cent.
“The Bank of England Base Rate plummeted in the wake of the demise of Lehman’s, which for some existing borrowers meant monthly payments were more on par with a mobile bill than a mortgage,” says David Hollingworth, mortgage specialist at L&C Mortgages.
“Ten years on, fixed rates, which is the product of choice for the majority of mortgage borrowers, have hit record lows and remain exceptionally cheap.
“To think it has been an easy ride for the mortgage market would be very wide of the mark. The tightening in lender funding saw criteria change rapidly and substantially, something that was only underlined by the tighter regulation that naturally ensued.”
The Mortgage Market Review has since ensured that criteria standards have not simply reverted back to the looser requirements of 2007. That means borrowers will continue to be grilled about their expenditure as well as their income to demonstrate affordability.
Homeowners have had to understand that the headline rate is only one part of selecting the right mortgage deal and that advice on differing lender criteria can play just as big a role in securing a mortgage in today’s market.
But low interest rates mean high mortgage affordability, even if applying for those mortgages is challenging in the extreme. And that affordability boosts the housing market.
The average UK house price fell from a pre-crisis peak of £190,032 in September 2007 to a low of £154,452 in March 2009, according to data from the Office for National Statistics (ONS) and the Land Registry.
Since then, it has recovered to £228,384, mostly driven by growth in the South and particularly South East of England.
The Northern Ireland and North East markets are still behind their peak of 2007, for example, and nationwide prices are now still low despite cheap mortgages, high demand and government savings deals like Help to Buy.
Saving & investing
“The scars of the financial crisis can be observed today in the abysmal rates still available on cash savings,” says Laith Khalaf, a senior analyst at Hargreaves Lansdown.
In September 2008, the average deposit account paid interest of 3.1 per cent, according to Bank of England data. That now stands at 0.43 per cent. Ten thousand pounds held on deposit for the last ten years would now be worth £10,852, or £8,790 if inflation is taken into account.
Meanwhile there has been a huge expansion in the amount of money held in accounts paying no interest, from £48bn in September 2008 to £164bn today.
Cash savers have been one of the great losers from the financial crisis.
But the negative sentiment towards today’s buoyant stock market is further proof that now old wounds are healing slowly for investors too.
“Lehman Brothers’ collapse prompted a fall in global markets including a 4 per cent fall in the FTSE 100 and a 5 per cent fall in the S&P 500,” says Khalaf.
“In four days of frantic trading the UK stock market shed around 10 per cent of its value. By Christmas it had lost almost a quarter of its value and almost six months later £10,000 invested in the FTSE All Share just before Lehman’s collapse was worth just £6,581. This was one of the most dramatic stock market falls in history.”
Clearly banking share prices came under a huge amount of pressure following the collapse of Lehman Brothers. An RBS share is now worth around 90 per cent less than on the day before Lehman’s collapse. It’s not however the worst performing FTSE 100 share over this period. Lonmin, the mining company long since relegated from the blue-chip index, has seen its shares fall 99.8 per cent over this period, turning £10,000 into just £22.30.
Perhaps surprisingly then, if you had invested that £10,000 on the eve of the Lehman’s failure, it would now be worth £14,893, without including dividends, and £21,352 with dividends reinvested.
Even if you happen to invest on the eve of such a catastrophic event, time remains a great healer.
Within the UK stock market, the UK’s mid-caps have beaten the big blue chips over this period, with the FTSE 250 producing a total return of £30,324 compared to £20,026 from the FTSE 100. The small caps have beaten the blue chips too, returning £27,575 over this period.
The list of the best performing FTSE 100 shares since the September 2008 crisis contains some surprising names. Despite markets taking a huge knock, the London Stock Exchange tops the list, as a key provider of the infrastructure that supports share trading – whether that’s buying or selling. Shares in the group have risen by more than 545 per cent since September 2008. Intercontinental Hotels, Next, Experian, Sky and Rolls-Royce are also winners.
Subscribe to Independent Premium to bookmark this article
Want to bookmark your favourite articles and stories to read or reference later? Start your Independent Premium subscription today.
Join our commenting forum
Join thought-provoking conversations, follow other Independent readers and see their replies