The Independent's journalism is supported by our readers. When you purchase through links on our site, we may earn commission.
US schools to get new world map after 500 years of 'colonial' distortion
Expert explains why maps of Britain show Cornwall 'ever so slightly' bigger than it actually is
Creating a map of the world presents a fundamental problem – how to turn the three-dimensional sphere of the Earth into a flat, two-dimensional image.
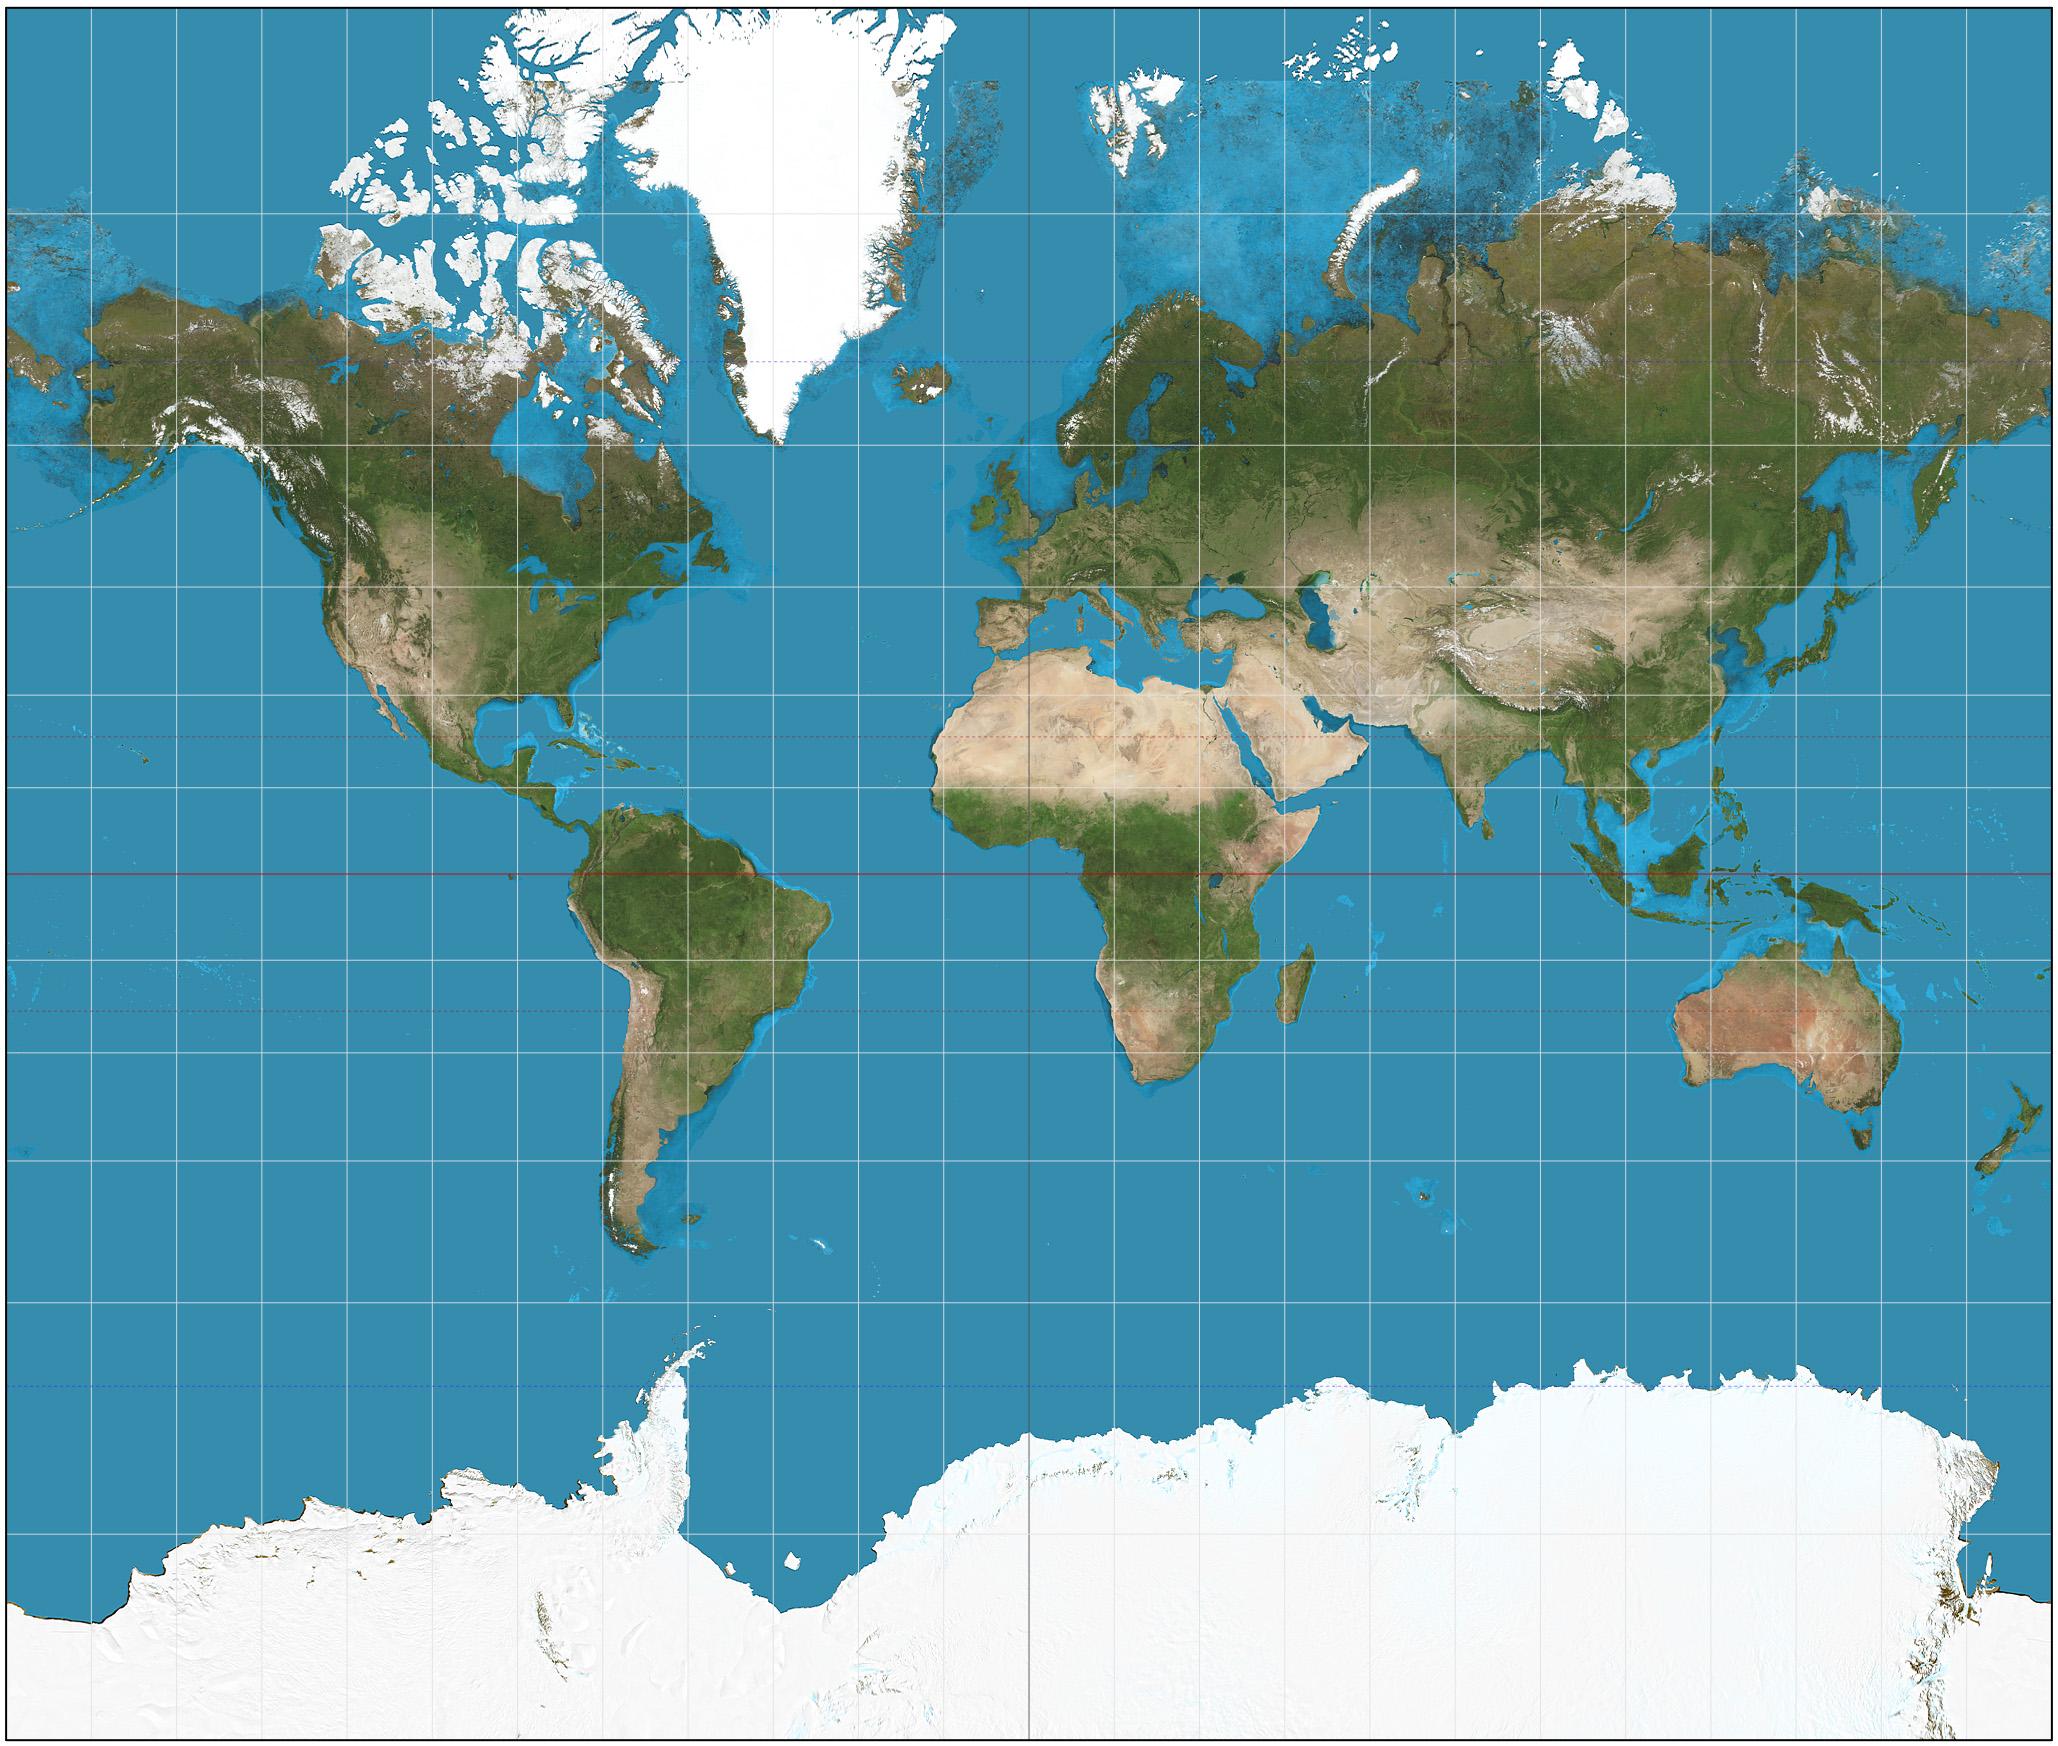
In 1569, the Flemish cartographer Gerardus Mercator devised an elegant solution that became the standard world map for the next five centuries.
But his method resulted in massive distortions of the relative sizes of the continents, dramatically shrinking Africa and making Europe, North America and particularly Greenland look much bigger than they actually are. Antarctica appears to be the largest continent.
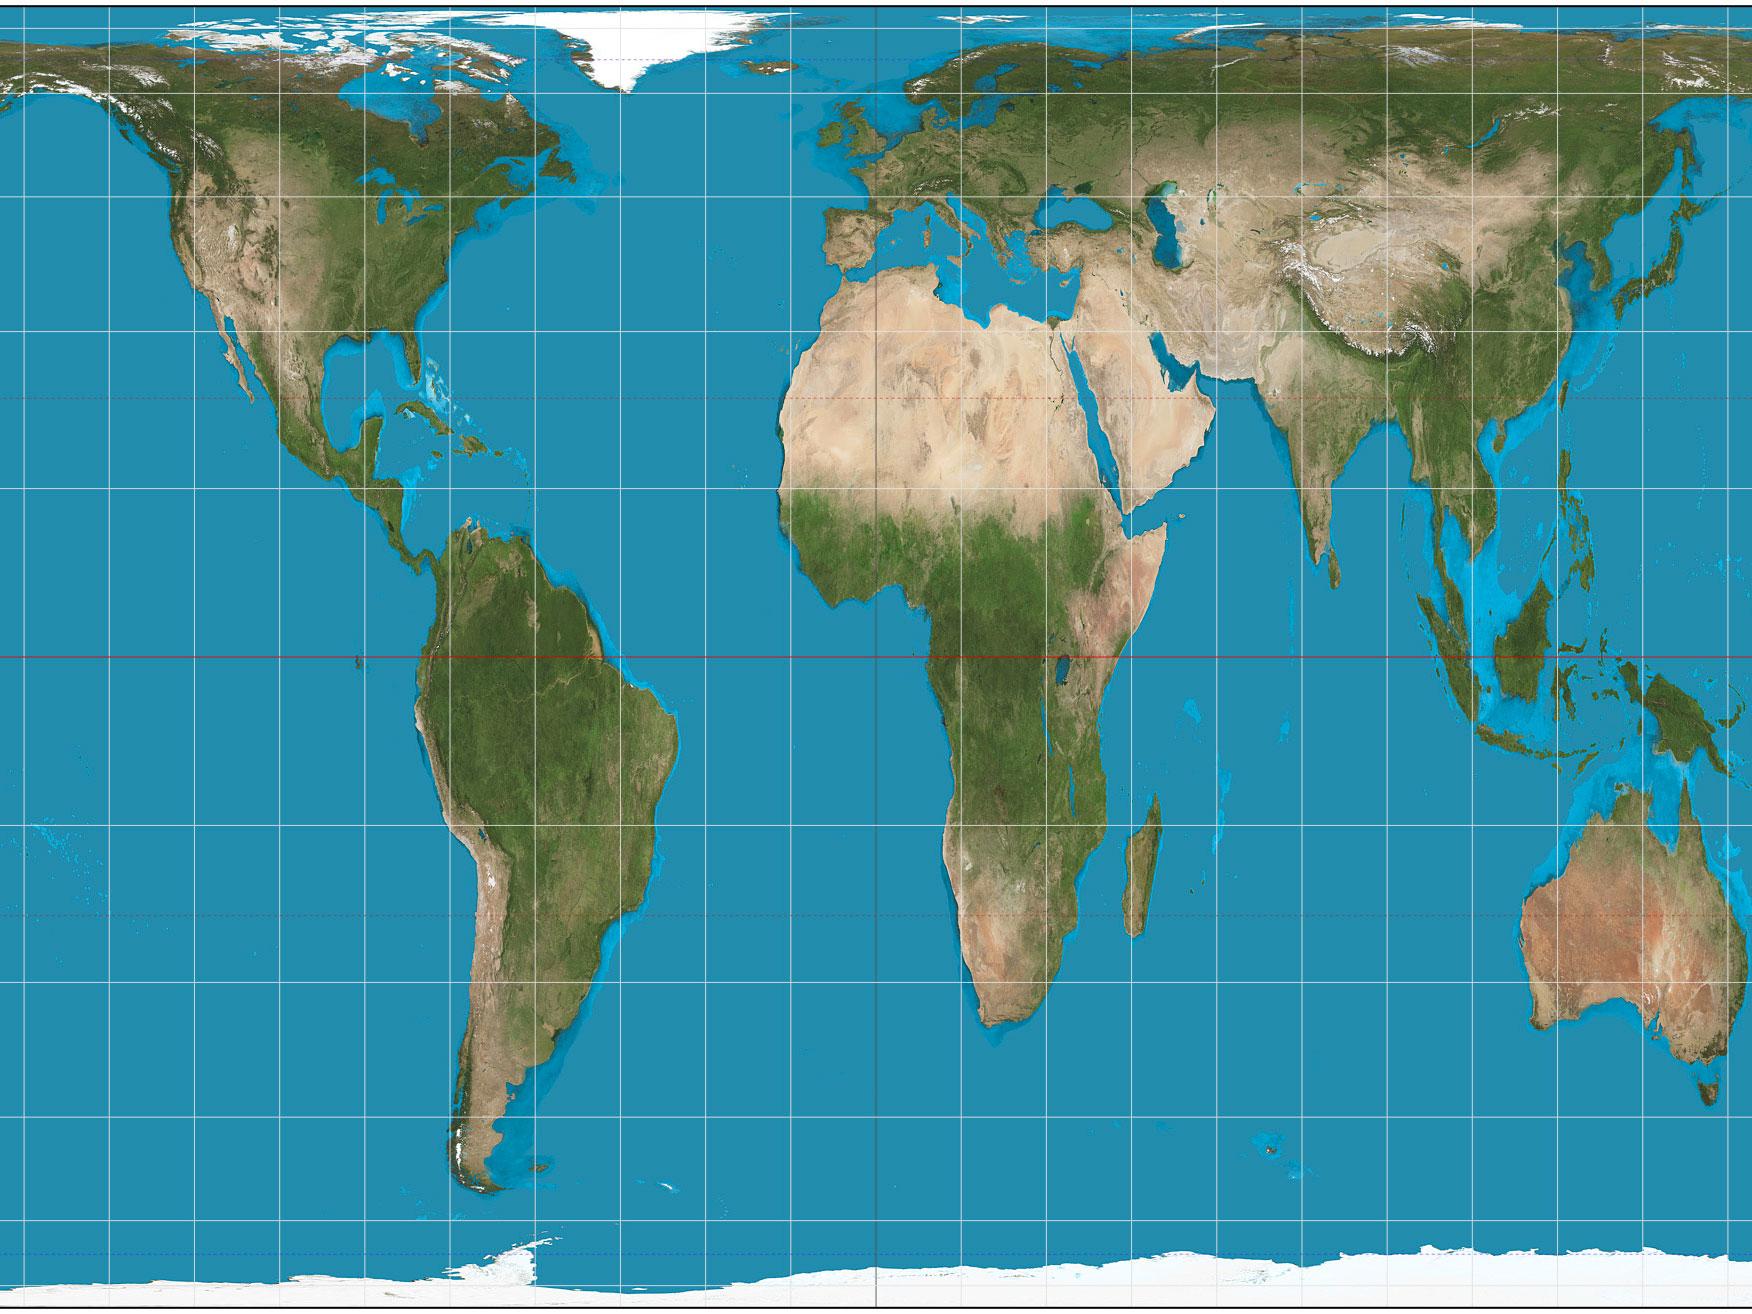
Now, for the first time, thousands of children in schools in the United States will use a very different map, the Gall-Peters projection.
About 600 school classrooms in Boston, Massachusetts, will receive a large laminated map that has come to symbolise efforts to correct the Western world’s distorted view of its own size.
Colin Rose, assistant superintendent in charge of the Boston Public Schools’ Office of Opportunity and Achievement Gaps, told The Boston Globe the move was part of an attempt to “decolonise the curriculum”.
“So this is about maps, but it isn’t about maps,” Mr Rose said.
“It’s about a paradigm shift … we’ve had a very fixed view that is very Eurocentric. How do we talk about other viewpoints? This is a great jump-off point.”
Mark Greaves, lead consultant for geodesy – the maths of map-making – at the Ordnance Survey (OS) said any flat map of a globe was “always involves some compromise”.
“With the Mercator projection, it gained popularity because it was fairly simple to calculate and yes, you could navigate with it because the angles remain fairly true,” he told The Independent.
“If you’re on a ship … it’s fairly straight-forward to translate from the map to real-life and vice-versa.”
But this accuracy was achieved at the expense of distortion that increases the further away from the equator.
The simplest way to explain how a Mercator map is created is to imagine a glass globe with a light inside. A sheet of paper is wrapped around the globe, touching at the equator, and then the lines of the continents are drawn onto the paper.
There is no distortion at the equator, but sizes gradually increase the further you get towards the poles. But when navigating over the kind of distances people tend to travel, this does not cause much of a problem.
The Gall-Peters projection concentrates on getting the sizes of the continents correct, so for example Africa appears to be about as large as it does on a globe.
Alaska also shrinks so that it no longer appears, wrongly, to be about the same size as the 48 mainland US states as shown on the Mercator map.
“Gall-Peters focuses on getting the area correct at the expense perhaps of scale or distance and certainly direction,” Mr Greaves said.
“You could navigate by Gall-Peters, but I wouldn’t.”
The OS maps the UK using a modified form of Mercator’s system. The cylinder of paper is wrapped around the Earth from east to west, rather than north to south.
And, instead of the equator, the cylinder is centred on the Earth at two degrees west. And it is sunk into the surface a little bit, in an attempt to minimise the distortion.
This means the map does not stretch the UK to make the northern and southern parts look bigger, but the eastern and western extremities – a good idea when trying to portray a long and relatively thin island, orientated north-south.
But there is still a small amount of unavoidable distortion.
“Cornwall is ever so slightly longer and wider on the map than it is in reality,” Mr Greaves said.
“But if you are a surveyor … you can take that into account when you measure the distance on the ground.”
He said the same thing could be done with a Gall-Peters projection but added this would probably involve more complicated calculations.
However, maps are about more than navigation.
Casey Cullen, a history teacher at Westborough High School in Boston, said when talking to pupils he would often cite the scholar Ali Mazrui, who once said: “Geography is the mother of history".
“The story starts from where we start,” Mr Cullen told the Globe. “If we’re going to try to tell the tale of people from other nations and where they come from, we need to be as accurate as possible.”
Join our commenting forum
Join thought-provoking conversations, follow other Independent readers and see their replies
Comments