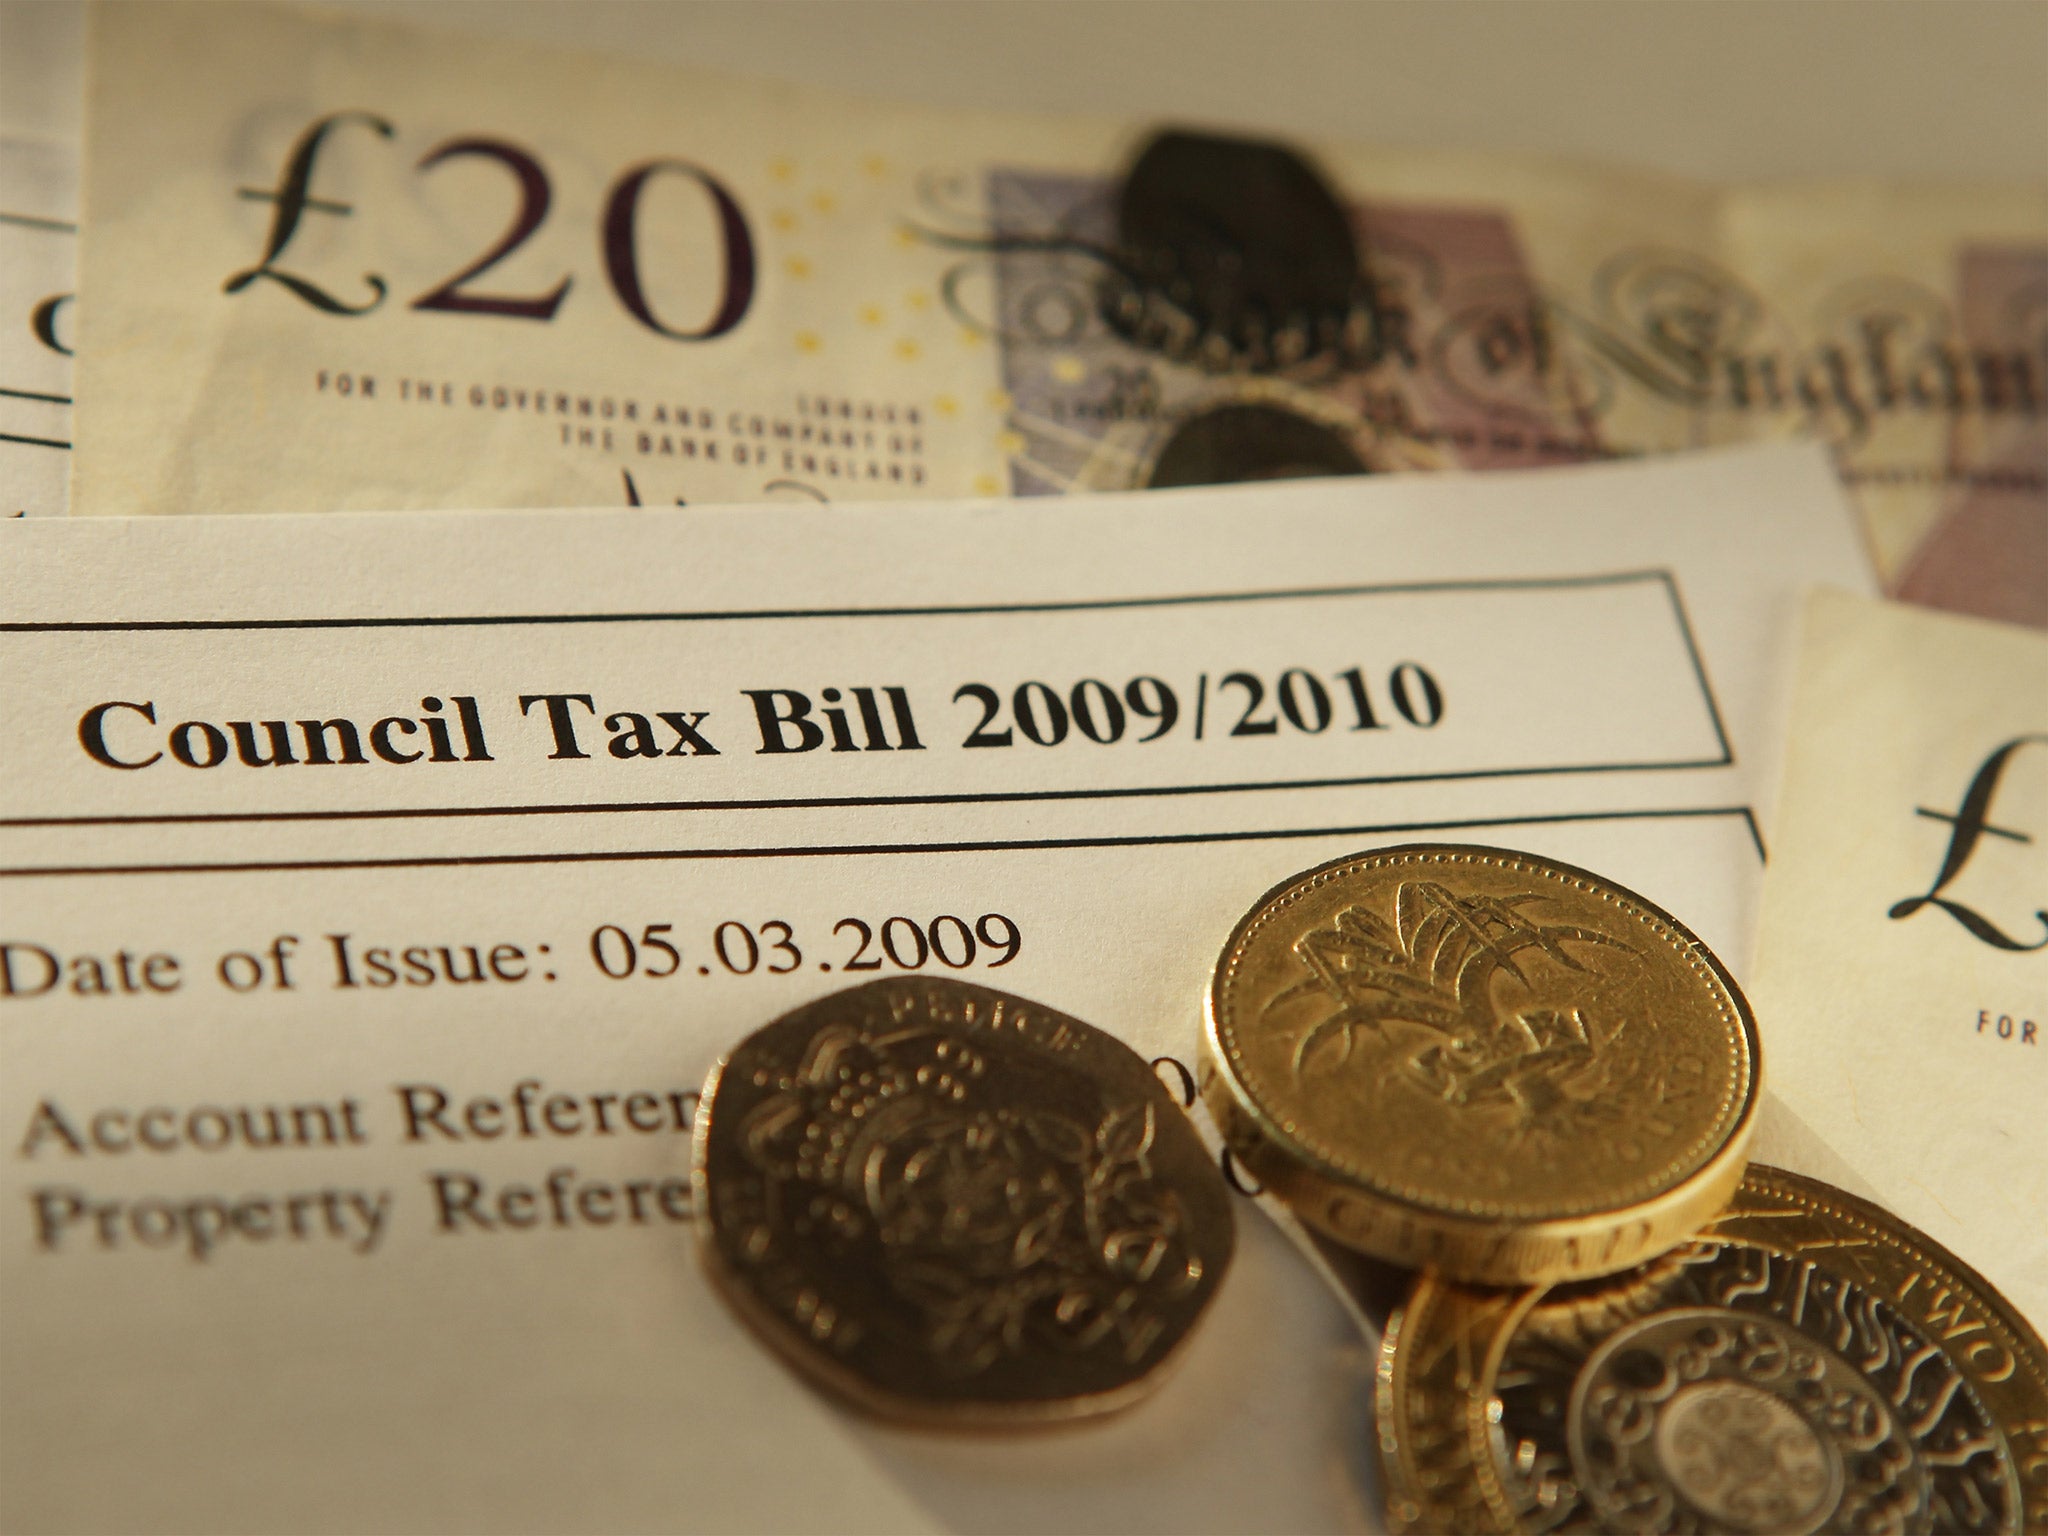
£483.60: our average weekly spend as Britain stays in the grip of a severe financial squeeze
The downturn has hit Government spending – and now it’s hitting ours, too. Ben Chu analyses the latest official statistics

Britain remains in the grip of a severe financial squeeze and the hard times are having a profoundly uneven impact on households across the land, the latest survey of spending by the Office for National Statistics suggested today.
The average weekly household expenditure was £483.60 in 2011, a £10 increase on 2010. But inflation over the year was 4.8%. So adjusted for inflation the average UK household spend actually fell by £14.60. Indeed, this is the sixth straight year that household spending has been fallen. In 2006 the average household was spending £49 more every week.
The latest figures should be handled with care. There are around 26.4 million households in the UK and they vary widely in size. Twenty nine per cent were single person. Thirty five per cent had two members. Sixteen per cent had three people. And a fifth had four or more people in them. Yet the figures broadly tell story of unavoidable expense and declining living standards.
The biggest category of expenditure, at £65.70 a week, was “transport”. Just over half of this was personal transport, meaning the costs of running a car. And most of the rise here was due to the impact of higher petrol prices as global oil prices soared. The third largest category is “housing, fuel and power”. This excludes mortgage cost, but covers rents, which have risen sharply. Also in this basket are electricity and gas bills, which everyone knows have been rising as energy firms have hiked their bills.
Groceries, the fourth largest category, are the quintessential unavoidable expense. Here, meat is the biggest cost. The figures also confirm the enduring dominance of the big supermarket chains, with just over 80 per cent of the average weekly £44.20 grocery bill filling the tills of Tesco, Sainsbury’s, Asda and Morrisons. Spending on big-ticket items is down. Audio-visual equipment and furniture spending has fallen. Clothing and footwear also declined, reflecting tough conditions on the High Street.
But what about fun? The second biggest category of expenditure is “recreation and culture”, which absorbed £63.90 of the average weekly budget. This covers football matches, satellite rental, TV licences, gambling and package holidays. Expenditure on cinema tickets rose, suggesting that austerity feeds an appetite for escapism.
The latest survey also showed a divided nation. The poorest 10 per cent of households groups spent an average of £177 a week, the richest ten per cent £1,010. The poorest spent a higher proportion of their income on essentials. Housing costs, petrol and energy bills accounted for 23 per cent of their weekly budgets. Food and drink was a 16 per cent share. Yet the richest ten per cent spent just 8 per cent on both sets of essentials.
There was a glaring regional divide too. The average weekly spend in London was £574.90 per week and £539.30 in the South East. People in the capital thus had 44 per cent more to spend than residents of Wales, where the average weekly budget was just £398.20. Londoners’ weekly outgoings were 50 per cent higher than those people in the North East, who had £384.20 to spend in a week.
That divergence has a lot to do with the fact that unemployment is catastrophic for a household’s spending power. The figures showed that average households in which the senior member was without a job spent £264.90 per week, compared with £593.60 where the senior member in work.
The figures show an age divide. Households where the senior member was aged between 30 and 49 spent £580.20 a week. Where the oldest person was aged 75 or over, the household spent only £272.60 (although elderly tend to live in smaller households).
Finally, the data shows a widening digital divide. Around 41 per cent of households in the lowest income group had internet access at home, rising to 99 per cent of the highest income households.
Join our commenting forum
Join thought-provoking conversations, follow other Independent readers and see their replies
Comments