Why I don’t believe the YouGov model predicting a hung parliament
For the prediction to be right something would have happened in the past two years that makes the national opinion polls more wrong in a pro-Tory direction than they have ever been

If a statistic looks interesting or unusual it is probably wrong. This is Twyman’s Law, named after Tony Twyman, the media research analyst, and it applies to this morning’s front-page headline in The Times: “Shock poll predicts Tory losses”.
YouGov, the polling company, has produced an “election model” which it says is not a prediction, which suggests that the Conservatives are currently likely to lose 21 seats, which would deprive Theresa May of her majority and mean that she would need the support of the Ulster unionists and the Liberal Democrats to stay in government.
YouGov has told us little about how this “estimate” is arrived at, and promises to publish full details this afternoon. All The Times says is that the model is a seat-by-seat analysis based on 50,000 interviews over a week, with the results weighted by location, EU referendum vote, age and social background.
It says that the model produces a range of seat figures, from the Tories gaining 14 seats to secure a majority of 40, to losing 57, which would make Labour the largest party in a hung parliament.
The only other information we have at this point is that the model implies a Conservative share of the vote of 42 per cent, with Labour on 38 per cent, the Lib Dems on 9 per cent and Ukip on 4 per cent. The Electoral Calculus website, which calculates how votes translate into seats on a uniform swing, produces a Tory majority of 16 on those numbers, although that doesn’t take into account the pattern of Ukip candidates. Ukip is not standing in 246 seats it contested last time, which is likely to help the Conservatives. The YouGov model therefore implies dramatic variation in swing around the country, to Labour’s advantage.
My view is that this model is bunkum and balderdash. I know the conventional national opinion polls can get things wrong. At the last election, the final polls underestimated the Conservatives by four points and overestimated Labour by two points. That means they got the gap between the two parties six points out. Since then, most of the pollsters have made adjustments to their methods. The YouGov model suggests that they are getting it that wrong again, but this time in the other direction, by overestimating the Conservatives. And that something strange has happened to seat-by-seat swing to exaggerate the effect.
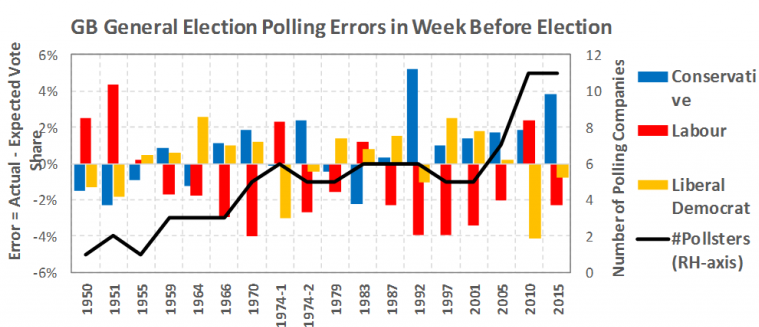
Usually, if the polls get it wrong, it is because they have the Conservatives too low and Labour too high. The last time they got it wrong in the other direction was in 1983 – Margaret Thatcher’s landslide victory – when the Tory share of the vote was overestimated by two points and Labour underestimated by one.
For the YouGov model to be right it would mean that something has happened in the past two years that makes the national opinion polls more wrong in a pro-Tory direction than they have ever been. Let us see what the company publishes this afternoon, but I have seen no evidence that this might be the case anywhere.
The YouGov model
Seats won YouGov
in 2015 estimate
Conservatives 331 310 -21
Labour 232 257 +25
SNP 56 50 -6
Lib Dem 8 10 +2
(The Times report uses the seat numbers as at dissolution: the better comparison is with the seats won last time.)
Update 4.30pm: YouGov has now published its election model, which will update vote share and seats estimates every day, with a lot of explanatory material. (The numbers are slightly different from above.) I do not pretend to understand how the data translates into individual seat results when, even with a huge national sample, there are only 75 respondents per constituency per week. So my views above still stand.
Join our commenting forum
Join thought-provoking conversations, follow other Independent readers and see their replies
Comments
Bookmark popover
Removed from bookmarks