Revealed: The 50 areas in the UK most likely to perish because of climate change
Greater London and Lincolnshire top of the list for UK places most likely to see damage from climate change, for example because of rising sea levels
The areas in the UK most at risk of climate change have been revealed by a new study.
The data focused on parts of the country most likely to be hit by extreme heat, forest fires, flooding and sea level rise.
Greater London and Lincolnshire are in the top 10% of places most at risk of this type of damage, according to climate data provider, XDI Systems.
Wales, East Riding in Yorkshire and Somerset rank third, fourth and fifth in the ‘XDI Gross Domestic Climate Risk’ list.
The most likely reason property will get damaged as a result of climate change is through river and coastal flooding due to sea level rising.


Regions most at risk are assessed by the total or ‘aggregated’ level of damage to buildings in that area because of climate change. This is projected for the year 2050
Analysts are also looking at extreme weather events that have already happened and how they impacted each area.
The study also looks at how much the percentage risk of damage has - and will continue to - increase between 1990 and 2050.
In Greater London, for instance, the risk of property damage is expected to have doubled by 2050 because of the coastal inundation threat. The Thames Barrier, which protects the city, is also seen as a risk, with concerns it will eventually stop working.
But its Scotland which has the most significant increase in damage, impacting multiple counties.
The risk is expected to have doubled by 2050 for half of all Scottish counties. This is only expected to happen in a quarter of England’s counties during the same time period.
Inverness stands out as its risk of climate change damage is forecast to triple between 1990 and 2050.
It makes it the largest increase predicted in all of Europe.
Big increases are also forecast in Shetland, Ross and Cromarty, Argyll and Bute and Nairn, all in Scotland, due to possible damage caused by sea level rises.
Globally, China, India and the US are all expected to see the greatest increase in damage caused by climate change.
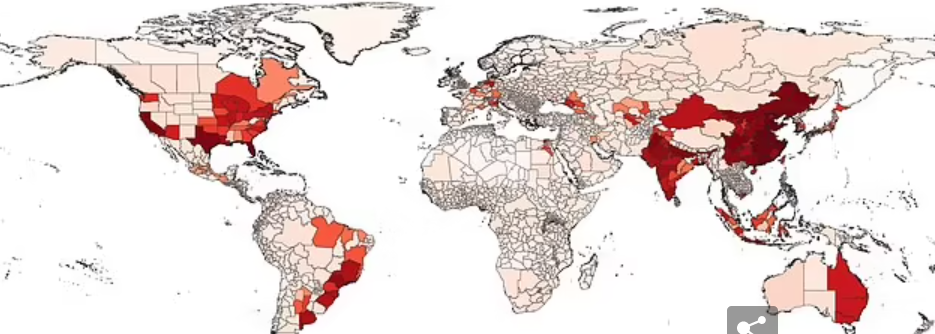
Out of the top 20 states and provinces in the world that are most vulnerable to climate change-caused damage, 16 are in China alone.
Many of the most at-risk areas around the world are also ones with some of the highest populations, according to XDI. Lots of them are also crucial in the global economy.
XDI CEO Rohan Hamden said: “It is crucial for companies, governments and investors to understand the financial and economic implications of physical climate risk and weigh this risk in their decision-making before these costs escalate beyond financial tipping points.”
Top 50 UK regions most vulnerable to climate change damage:
1. Lincolnshire. Global ranking - 184. Percentage increase in damage risk 1950 - 2050 - 102%
2. Greater London. Global ranking - 263. Percentage increase in damage risk 1950 - 2050 - 92%
3. Wales. Global ranking - 298. Percentage increase in damage risk 1950 - 2050 - 144%
4. East Riding of Yorkshire. Global ranking - 323 . Percentage increase in damage risk 1950 - 2050 - 88%
5. Somerset. Global ranking - 458 . Percentage increase in damage risk 1950 - 2050 - 92%
6. Cambridgeshire. Global ranking - 508 . Percentage increase in damage risk 1950 - 2050 - 100%
7. Norfolk. Global ranking - 537 . Percentage increase in damage risk 1950 - 2050 - 102%
8. Kent. Global ranking - 561 . Percentage increase in damage risk 1950 - 2050 - 110%
9. Essex. Global ranking - 577 . Percentage increase in damage risk 1950 - 2050 - 93%
10. Lancashire. Global ranking - 614 . Percentage increase in damage risk 1950 - 2050 - 134%
11. Northern Ireland. Global ranking - 778 . Percentage increase in damage risk 1950 - 2050 - 83%
12. Merseyside. Global ranking - 818 . Percentage increase in damage risk 1950 - 2050 - 102%
13. Greater Manchester. Global ranking - 873 . Percentage increase in damage risk 1950 - 2050 - 65%
14. Hampshire. Global ranking - 890 . Percentage increase in damage risk 1950 - 2050 - 118%
15. South Yorkshire. Global ranking - 927 . Percentage increase in damage risk 1950 - 2050 - 76%
16. Bristol. Global ranking - 947 . Percentage increase in damage risk 1950 - 2050 - 92%
17. Cheshire. Global ranking - 973 . Percentage increase in damage risk 1950 - 2050 - 84%
18. West Midlands. Global ranking - 893 . Percentage increase in damage risk 1950 - 2050 - 76%
19. Gloucestershire. Global ranking - 1001 . Percentage increase in damage risk 1950 - 2050 - 109%
20. Devon. Global ranking - 1042 . Percentage increase in damage risk 1950 - 2050 - 90%
21. North Yorkshire. Global ranking - 1073 . Percentage increase in damage risk 1950 - 2050 - 63%
22. East Sussex. Global ranking - 1080 . Percentage increase in damage risk 1950 - 2050 - 109%
23. West Sussex. Global ranking - 1105 . Percentage increase in damage risk 1950 - 2050 - 107%
24. West Yorkshire. Global ranking - 1129. Percentage increase in damage risk 1950 - 2050 - 31%
25. Suffolk. Global ranking - 1204 . Percentage increase in damage risk 1950 - 2050 - 94%
26. Surrey. Global ranking - 1234 . Percentage increase in damage risk 1950 - 2050 - 49%
27. Berkshire. Global ranking - 1311 . Percentage increase in damage risk 1950 - 2050 - 61%
28. Durham. Global ranking - 1347 . Percentage increase in damage risk 1950 - 2050 - 64%
29. Leicestershire. Global ranking - 1376 . Percentage increase in damage risk 1950 - 2050 - 38%
30. Nottinghamshire. Global ranking - 1381 . Percentage increase in damage risk 1950 - 2050 - 41%
31. Tyne & Wear. Global ranking - 1407 . Percentage increase in damage risk 1950 - 2050 - 62%
32. Staffordshire. Global ranking - 1439 . Percentage increase in damage risk 1950 - 2050 - 44%
33. Derbyshire. Global ranking - 1481 . Percentage increase in damage risk 1950 - 2050 - 34%
34. Worcestershire. Global ranking - 1517 . Percentage increase in damage risk 1950 - 2050 - 156%
35. Hertfordshire. Global ranking - 1524 . Percentage increase in damage risk 1950 - 2050 - 51%
36. Buckinghmshire. Global ranking - 1571 . Percentage increase in damage risk 1950 - 2050 - 58%
37. City of Glasgow. Global ranking - 1652 . Percentage increase in damage risk 1950 - 2050 - 103%
38. Bedfordshire. Global ranking - 1653 . Percentage increase in damage risk 1950 - 2050 - 58%
39. Northamptonshire. Global ranking - 1656 . Percentage increase in damage risk 1950 - 2050 - 52%
40. Ayrshire and Arran. Global ranking - 1659 . Percentage increase in damage risk 1950 - 2050 - 108%
41. Cumbria. Global ranking - 1684 . Percentage increase in damage risk 1950 - 2050 - 67%
42. Inverness. Global ranking - 1698 . Percentage increase in damage risk 1950 - 2050 - 237%
43. Warwickshire. Global ranking - 1699 . Percentage increase in damage risk 1950 - 2050 - 55%
44. Oxfordshire. Global ranking - 1712 . Percentage increase in damage risk 1950 - 2050 - 59%
45. Wiltshire. Global ranking - 1723 . Percentage increase in damage risk 1950 - 2050 - 91%
46. Dorset. Global ranking - 1743 . Percentage increase in damage risk 1950 - 2050 - 76%
47. Cornwall. Global ranking - 1745 . Percentage increase in damage risk 1950 - 2050 - 92%
48. Herefordshire. Global ranking - 1763 . Percentage increase in damage risk 1950 - 2050 - 170%
49. Stirling and Falkirk. Global ranking - 1809 . Percentage increase in damage risk 1950 - 2050 - 132%
50. Northumberland. Global ranking - 1810 . Percentage increase in damage risk 1950 - 2050 - 82%
Join our commenting forum
Join thought-provoking conversations, follow other Independent readers and see their replies
Comments
Bookmark popover
Removed from bookmarks