The Ultimate Reliability Survey 2017
Over 14,000 motorists bare all about their experiences with 0-3yr old cars over the last year
Here’s a question. If you own a car that’s always breaking down and leaving you in the lurch, or just spending too much of its time in the garage having a load of silly faults sorted out, how likely are you to buy another car from that company?
We all know the answer to that one.
Reliability is massively important to car buyers. That should make it equally important to car manufacturers, because it’s what keeps customers coming back into their dealerships time after time.
Owners of 14,208 cars were asked if their cars had recorded any faults in the last 12 months. The problems were arranged in 14 groups: battery, bodywork, brakes, engine, engine electrics, exhaust, exterior lights, fuel system, gearbox/clutch, interior trim, non-engine electrics, steering, suspension, and ‘other’.
The owners were asked to specify the amount of time each fault caused their cars to spend ‘off the road’, from ‘less than one day’ to ‘more than a week’. The cost of repairs was factored in too, categorised in a range from ‘fixed under warranty for free’ to ‘more than £1500’. The scores for that section of the survey were weighted according to the impact of the fault: problems that cost more and/or kept cars out of use for a longer period of time were punished hardest.
The data were collated to produce a list of the most – and the least – reliable 0-3-year-old cars from a range of 32 brands and 169 models. And here is that list.
Reliability by brand (cars 0-3yrs old)
|
| Brand | Score |
|---|---|---|
| 1 | Lexus | 92.1% |
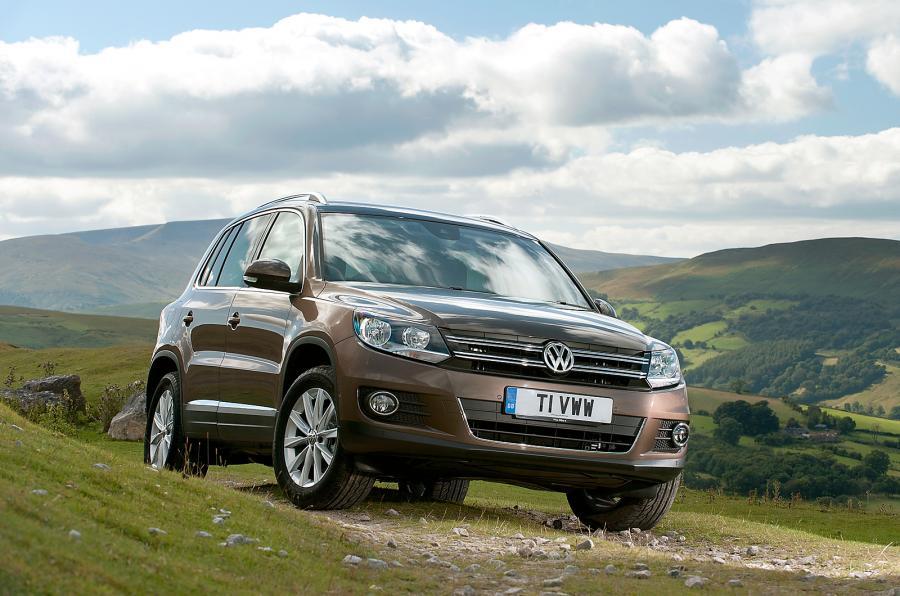
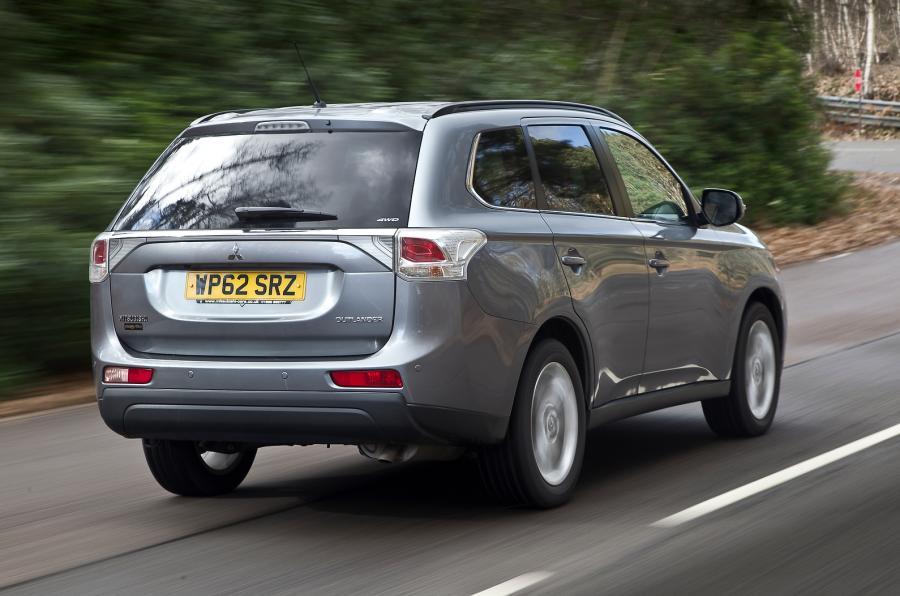
| 2 | Mitsubishi | 90.8% |
| 3 | Toyota | 89.6% |
| 4 | Suzuki | 86.6% |
| 5 | Alfa Romeo | 85.8% |
| 6 | Honda | 84.9% |
| 7 | Hyundai | 84.8% |
| 8 | MG | 83.4% |
| 9 | Ford | 82.1% |
| 10 | Subaru | 81.8% |
| 11 | Kia | 81.3% |
| 12 | Audi | 80.4% |
| 13 | Skoda | 80.1% |
| 14 | Mini | 79.6% |
| 15 | Porsche | 78.3% |
| 16 | Mazda | 77.9% |
| 17 | BMW | 77.6% |
| 18 | Vauxhall | 76.4% |
| 19 | Dacia | 75.9% |
| 20 | Renault | 75.4% |
| 21 | Seat | 75.2% |
| 22 | Volkswagen | 74.7% |
| 23 | Mercedes-Benz | 70.4% |
| 24 | Fiat | 70.2% |
| 25 | Volvo | 62.3% |
| 26 | Jaguar | 61.9% |
| 27 | Peugeot | 56.7% |
| 28 | Citroën | 55.2% |
| 29 | Nissan | 52.7% |
| 30 | Tesla | 52.4% |
| 31 | Land Rover | 50.6% |
| 32 | Jeep | 42.1% |
Reliability tables were also produced for car groupings. Here they are, starting with City Cars aged 0-3 years.
| Rank | Make and model | Score |
|---|---|---|
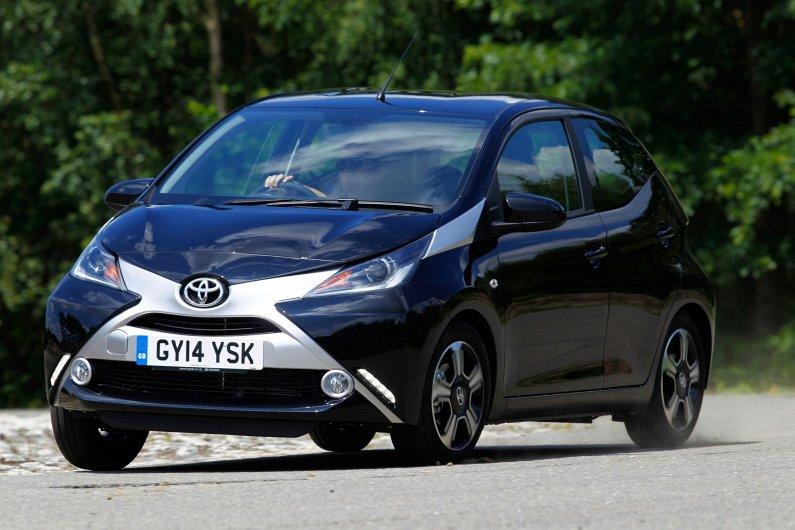
| 1 | Toyota Aygo (2014-present) | 100.0% |
| 2 | Kia Picanto (2011-2017) | 89.6% |
| 3 | Skoda Citigo (2012-present) | 88.5% |
| 4 | Hyundai i10 Hatchback (2014-present) | 88.1% |
| 5 | Fiat 500 (2008-present) | 85.2% |
| 6 | Fiat Panda (2012-present) | 75.5% |
| 7 | Volkswagen Up (2012-present) | 74.8% |
Small Cars

| Rank | Make and model | Score |
|---|---|---|
| 1 | Honda Jazz (2015-present) | 100.0% |
| 2 | Toyota Yaris (2011-present) | 94.2% |
| 3 | Audi A1 Sportback (2012-present) | 93.1% |
| 4 | Honda Jazz (2008-2015) | 91.6% |
| 5 | Renault Clio petrol (2012-present) | 90.1% |
| 6 | Skoda Fabia hatch and estate (2015-present) | 88.7% |
| 7 | Ford Fiesta (2008-2017) | 88.3% |
| 8 | Hyundai i20 petrol (2015-present) | 88.2% |
| 9 | Suzuki Swift (2011-2017) | 87.7% |
| 10 | Audi A1 3dr (2010-present) | 86.9% |
| 11 | Renault Clio diesel (2012-present) | 86.4% |
| 12 | Mini hatchback diesel (2014-present) | 85.9% |
| 13 | MG 3 (2013-present) | 83.4% |
| 14 | Dacia Sandero (2013-present) | 82.2% |
| 15 | Mini hatchback diesel (2014-present) | 80.5% |
| 16 | Hyundai i20 (2009-2015) | 78.7% |
| 17 | Seat Ibiza (2009-2017) | 68.0% |
| 18 | Mini Clubman (2015-present) | 64.6% |
| 19 | Volkswagen Polo (2009-2017) | 58.8% |
| 20 | Mazda 2 (2015-present) | 52.7% |
| 21 | Nissan Note (2013-present) | 48.6% |
Family Cars
| Rank | Make and model | Score |
|---|---|---|
| 1 | 100.0% | |
| 2 | 94.5% | |
| 3 | 91.7% | |
| 4 | 90.4% | |
| 5 | 88.0% | |
| 6 | Toyota Auris hatchback and estate (2012-present) | 87.1% |
| 7 | 86.7% | |
| 8 | 84.0% | |
| 9 | BMW 2 Series Active Tourer petrol (2014-present) | 83.1% |
| 10 | 82.6% | |
| 11 | 82.1% | |
| 12 | 82.0% | |
| 13 | Mercedes-Benz A Class (2013-present) | 81.2% |
| 14 | Volvo V40 petrol (2012-present) | 79.9% |
| 15 | 78.9% | |
| 16 | 76.0% | |
| 17 | 74.8% | |
| 18 | 74.5% | |
| 19 | 74.4% | |
| 20 | 72.2% | |
| 21 | 72.1% | |
| 22 | 68.5% | |
| 23 | 66.6% | |
| 24 | 65.4% | |
| 25 | 62.3% | |
| 26 | 58.4% | |
| 27 | 55.5% | |
| 28 | Nissan Pulsar (2014-present) | 48.3% |
MPVs
| Rank | Make and model | Score |
|---|---|---|
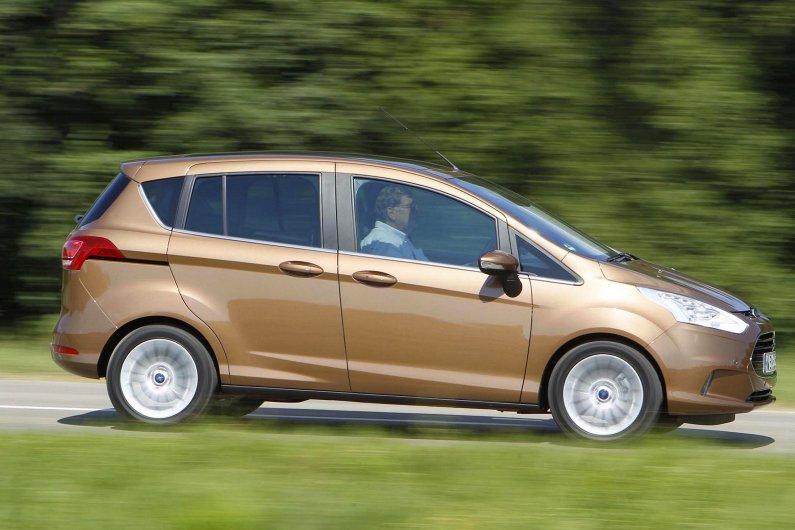
| 1 | Ford B-Max (2012-present) | 91.6% |
| 2 | Ford C-Max (2010-present) | 90.0% |
| 3 | Volkswagen Golf SV (2014-present) | 83.2% |
| 4 | 78.4% | |
| 5 | Volkswagen Touran diesel (2015-present) | 65.2% |
| 6 | 56.8% | |
| 7 | 46.2% |
Small SUVs
| Rank | Make and model | Score |
|---|---|---|
| 1 | 96.3% | |
| 2 | 92.8% | |
| 3 | 92.7% | |
| 4 | 88.9% | |
| 5 | 88.2% | |
| 6 | 87.7% | |
| 7 | 87.2% | |
| 8 | 86.6% | |
| 9 | 86.1% | |
| 10 | Vauxhall Mokka diesel (2012-2016) | 85.6% |
| 11 | Suzuki Vitara (2015-present) | 84.2% |
| 12 | 81.3% | |
| 13 | 79.4% | |
| 14 | Audi Q3 diesel (2011-present) | 78.7% |
| 15 | 77.1% | |
| 16 | 76.3% | |
| 17 | 75.5% | |
| 18 | 75.4% | |
| 19 | 74.6% | |
| 20 | 74.2% | |
| 21 | 73.9% | |
| 22 | 71.3% | |
| 23 | 70.3% | |
| 24 | 70.0% | |
| 25 | 66.7% | |
| 26 | 62.9% | |
| 27 | Mercedes-Benz GLA (2014-2017) | 58.6% |
| 28 | 56.2% | |
| 29 | 55.2% | |
| 30 | 44.2% | |
| 31 | 42.1% | |
| 32 | 32.3% | |
| 33 | 28.9% |
Large SUVs
| Rank | Make and model | Score |
|---|---|---|
| 1 | 91.2% | |
| 2 | 90.1% | |
| 3 | Volkswagen Touareg diesel (2010-present) | 87.1% |
| 4 | 83.4% | |
| 5 | Toyota RAV4 diesel (2013-present) | 82.3% |
| 6 | Subaru Forester (2013-present) | 81.8% |
| 7 | 79.6% | |
| 8 | 79.4% | |
| 9 | 79.0% | |
| 10 | 78.0% | |
| -11 | 76.9% | |
| =11 | 76.9% | |
| 13 | 76.2% | |
| 14 | 76.0% | |
| 15 | 71.8% | |
| 16 | 70.7% | |
| 17 | 68.1% | |
| 18 | 67.3% | |
| 19 | 66.5% | |
| 20 | 64.0% | |
| 21 | 63.6% | |
| 22 | 55.8% | |
| 23 | 54.2% | |
| 24 | Range Rover Evoque diesel (2011-present) | 52.0% |
| 25 | 43.8% | |
| 26 | 22.6% | |
| 27 | 14.5% |
Executive cars
| Rank | Make and model | Score |
|---|---|---|
| 1 | 100.0% | |
| 2 | 90.9% | |
| 3 | 88.5% | |
| 4 | 87.5% | |
| 5 | 86.3% | |
| 6 | 85.4% | |
| 7 | Mazda 6 petrol saloon (2013-present) | 85.0% |
| 8 | 81.8% | |
| 9 | 81.4% | |
| 10 | 80.5% | |
| 11 | 79.8% | |
| 12 | 78.4% | |
| 13 | 78.0% | |
| 14 | 76.5% | |
| =15 | 74.7% | |
| =15 | 74.7% | |
| 17 | 73.9% | |
| 18 | 72.7% | |
| 19 | 68.7% | |
| 20 | 65.2% | |
| 21 | 64.7% | |
| 22 | Volvo S60/V60 (2010-present) | 64.4% |
| 23 | Volkswagen CC diesel (2012-2016) | 58.0% |
| 24 | 36.7% | |
|
|
|
|
Luxury Cars
| Rank | Make and model | Score |
|---|---|---|
| 1 | 93.2% | |
| 2 | 92.1% | |
| 3 | 75.3% | |
| 4 | Volvo V70 (2007-2013) | 75.1% |
| 5 | Jaguar XF saloon/Sportbrake (2008-2015) | 72.3% |
| 6 | 66.8% | |
| 7 | 62.2% | |
| 8 | 46.1% |
Coupés and convertibles
| Rank | Make and model | Score |
|---|---|---|
| 1 | 92.5% | |
| 2 | BMW 2 Series Coupé/Convertible (2014-present) | 90.8% |
| 3 | 85.0% | |
| 4 | 79.8% | |
| 5 | 79.6% | |
| 6 | 76.0% | |
| 7 | Mercedes-Benz SLK (2011-2016) | 73.6% |
| 8 | 71.0% |
Electric vehicles
| Rank | Make and model | Score |
|---|---|---|
| 1 | 93.9% | |
| 2 | BMW i3 (2013-present) | 88.5% |
| 3 | 65.1% | |
| 4 | 52.4% |
So, what does it all mean? Well, for maximum reliability in a new car you can't afford to ignore the top-ranked Japanese and Korean brands on our list. Having said that, some Nissan models may well bite you in a painful place.
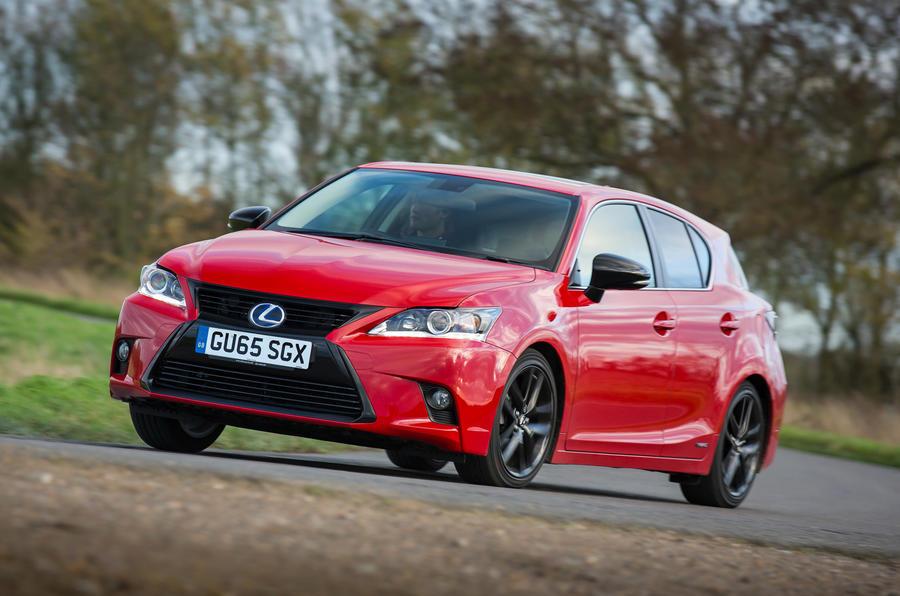
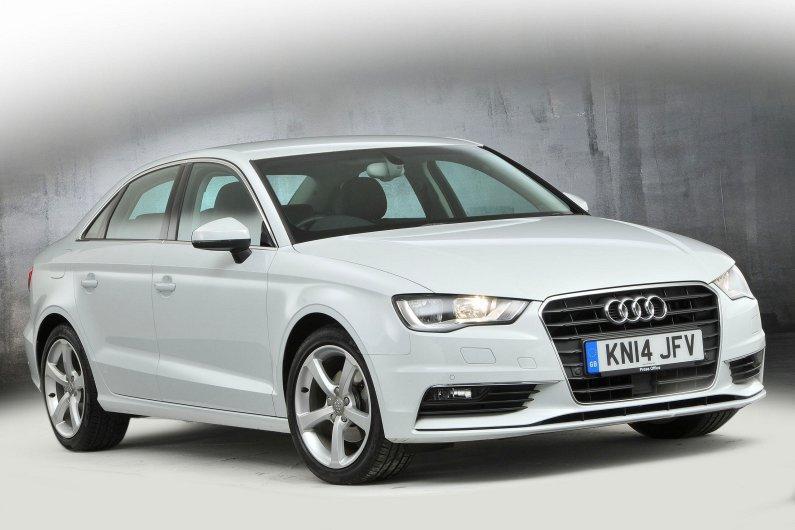
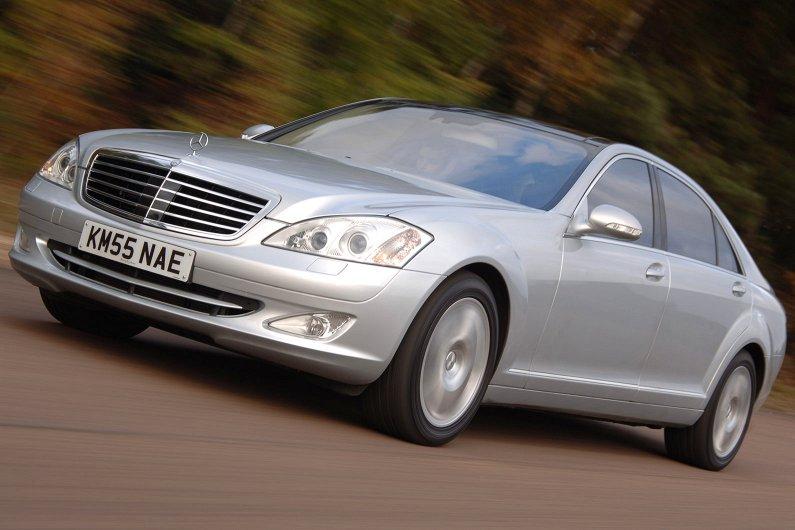
Going ‘premium’ doesn’t necessarily protect you either. The names Jaguar, Mercedes-Benz and Volvo all figure at the wrong end of our brand table. As far as individual models go, four cars stood out with 100% reliability ratings: the Audi A3 Saloon, Honda Jazz, Lexus CT200h and Toyota Aygo.
The most frequently mentioned faults were non-engine electrics. Air-con and sat-nav systems were most often complained about. Models at the bottom of our lists weren’t immune to major mechanical issues that, in some cases, required owners to chip in financially to get fixed.
Join our commenting forum
Join thought-provoking conversations, follow other Independent readers and see their replies
Comments
Bookmark popover
Removed from bookmarks