David Blanchflower: Do not be fooled – growth and living standards under the Coalition have still been abysmal
Over the past six-year period real earnings in the UK fell 6.5 per cent. Only Greece was worse

Hang out the bunting, all is well: the Office for National Statistics has revised GDP growth upwards. This was done to put the UK in line with international reporting practices. But this really doesn’t change the big picture I have discussed in this column these many months, of an economy that was growing when the Coalition inherited it in May 2010 but then flatlined for two years before growing again, is essentially unchanged.
We are still struggling through what Keynes called the “long dragging conditions of semi-slump, which may be expected to succeed the acute phase”. There was no double-dip but growth under the Coalition is confirmed to have been anaemic.
Output is now estimated to have dropped 6 per cent from peak to trough. The Great Recession started in Q2 2008, which was the first negative quarter, and it took until Q3 2013 to restore lost output. That is 66 months, which still makes it the longest-lasting recession since the South Sea Bubble. Lost output in the Great Depression was restored in 48 months. The recession of 1973-79 was restored in 44 months; the 1979-1985 was restored in 48 months; and the 1990-1996 recession in 30 months. This is the slowest post-war recovery.
Revisions to the annual rate of real GDP growth from 1997-2012 are small at only 0.1 percentage points, making it only 2 per cent higher. To this point we don’t have revisions for subsequent years but they are coming. Other countries have also been revising their GDP estimates, and some by even more than the UK, so our relative position is largely unaltered. Andrew Walton* from the ONS has made clear that the impact of the upward revisions on real GDP are likely to be higher in Austria, Denmark, France, Germany, the Netherlands, Sweden and the United States than they are in the UK.
The ONS made clear that GDP revisions do not provide a solution to the “productivity conundrum”, and the level of output per hour worked at the end of 2012 was still around 12 per cent below the projected path if the pre-downturn trend in growth had been maintained. Changes to the treatment of employers’ pension contributions, however, have markedly raised the household saving ratio between 1997 and 2009 by between approximately 2 and 5 percentage points a year.
But let’s not get carried away. As the ONS notes in its Economic Review, September 2014, “the broad narrative of the economic downturn is unaltered. The recent downturn has been the deepest since ONS records began in 1948. The recovery has also been the slowest … . GDP per capita in the UK is now estimated to be a little stronger than previously published, it remains 5.1 per cent below its Q1 2008 level in Q4 2012”.
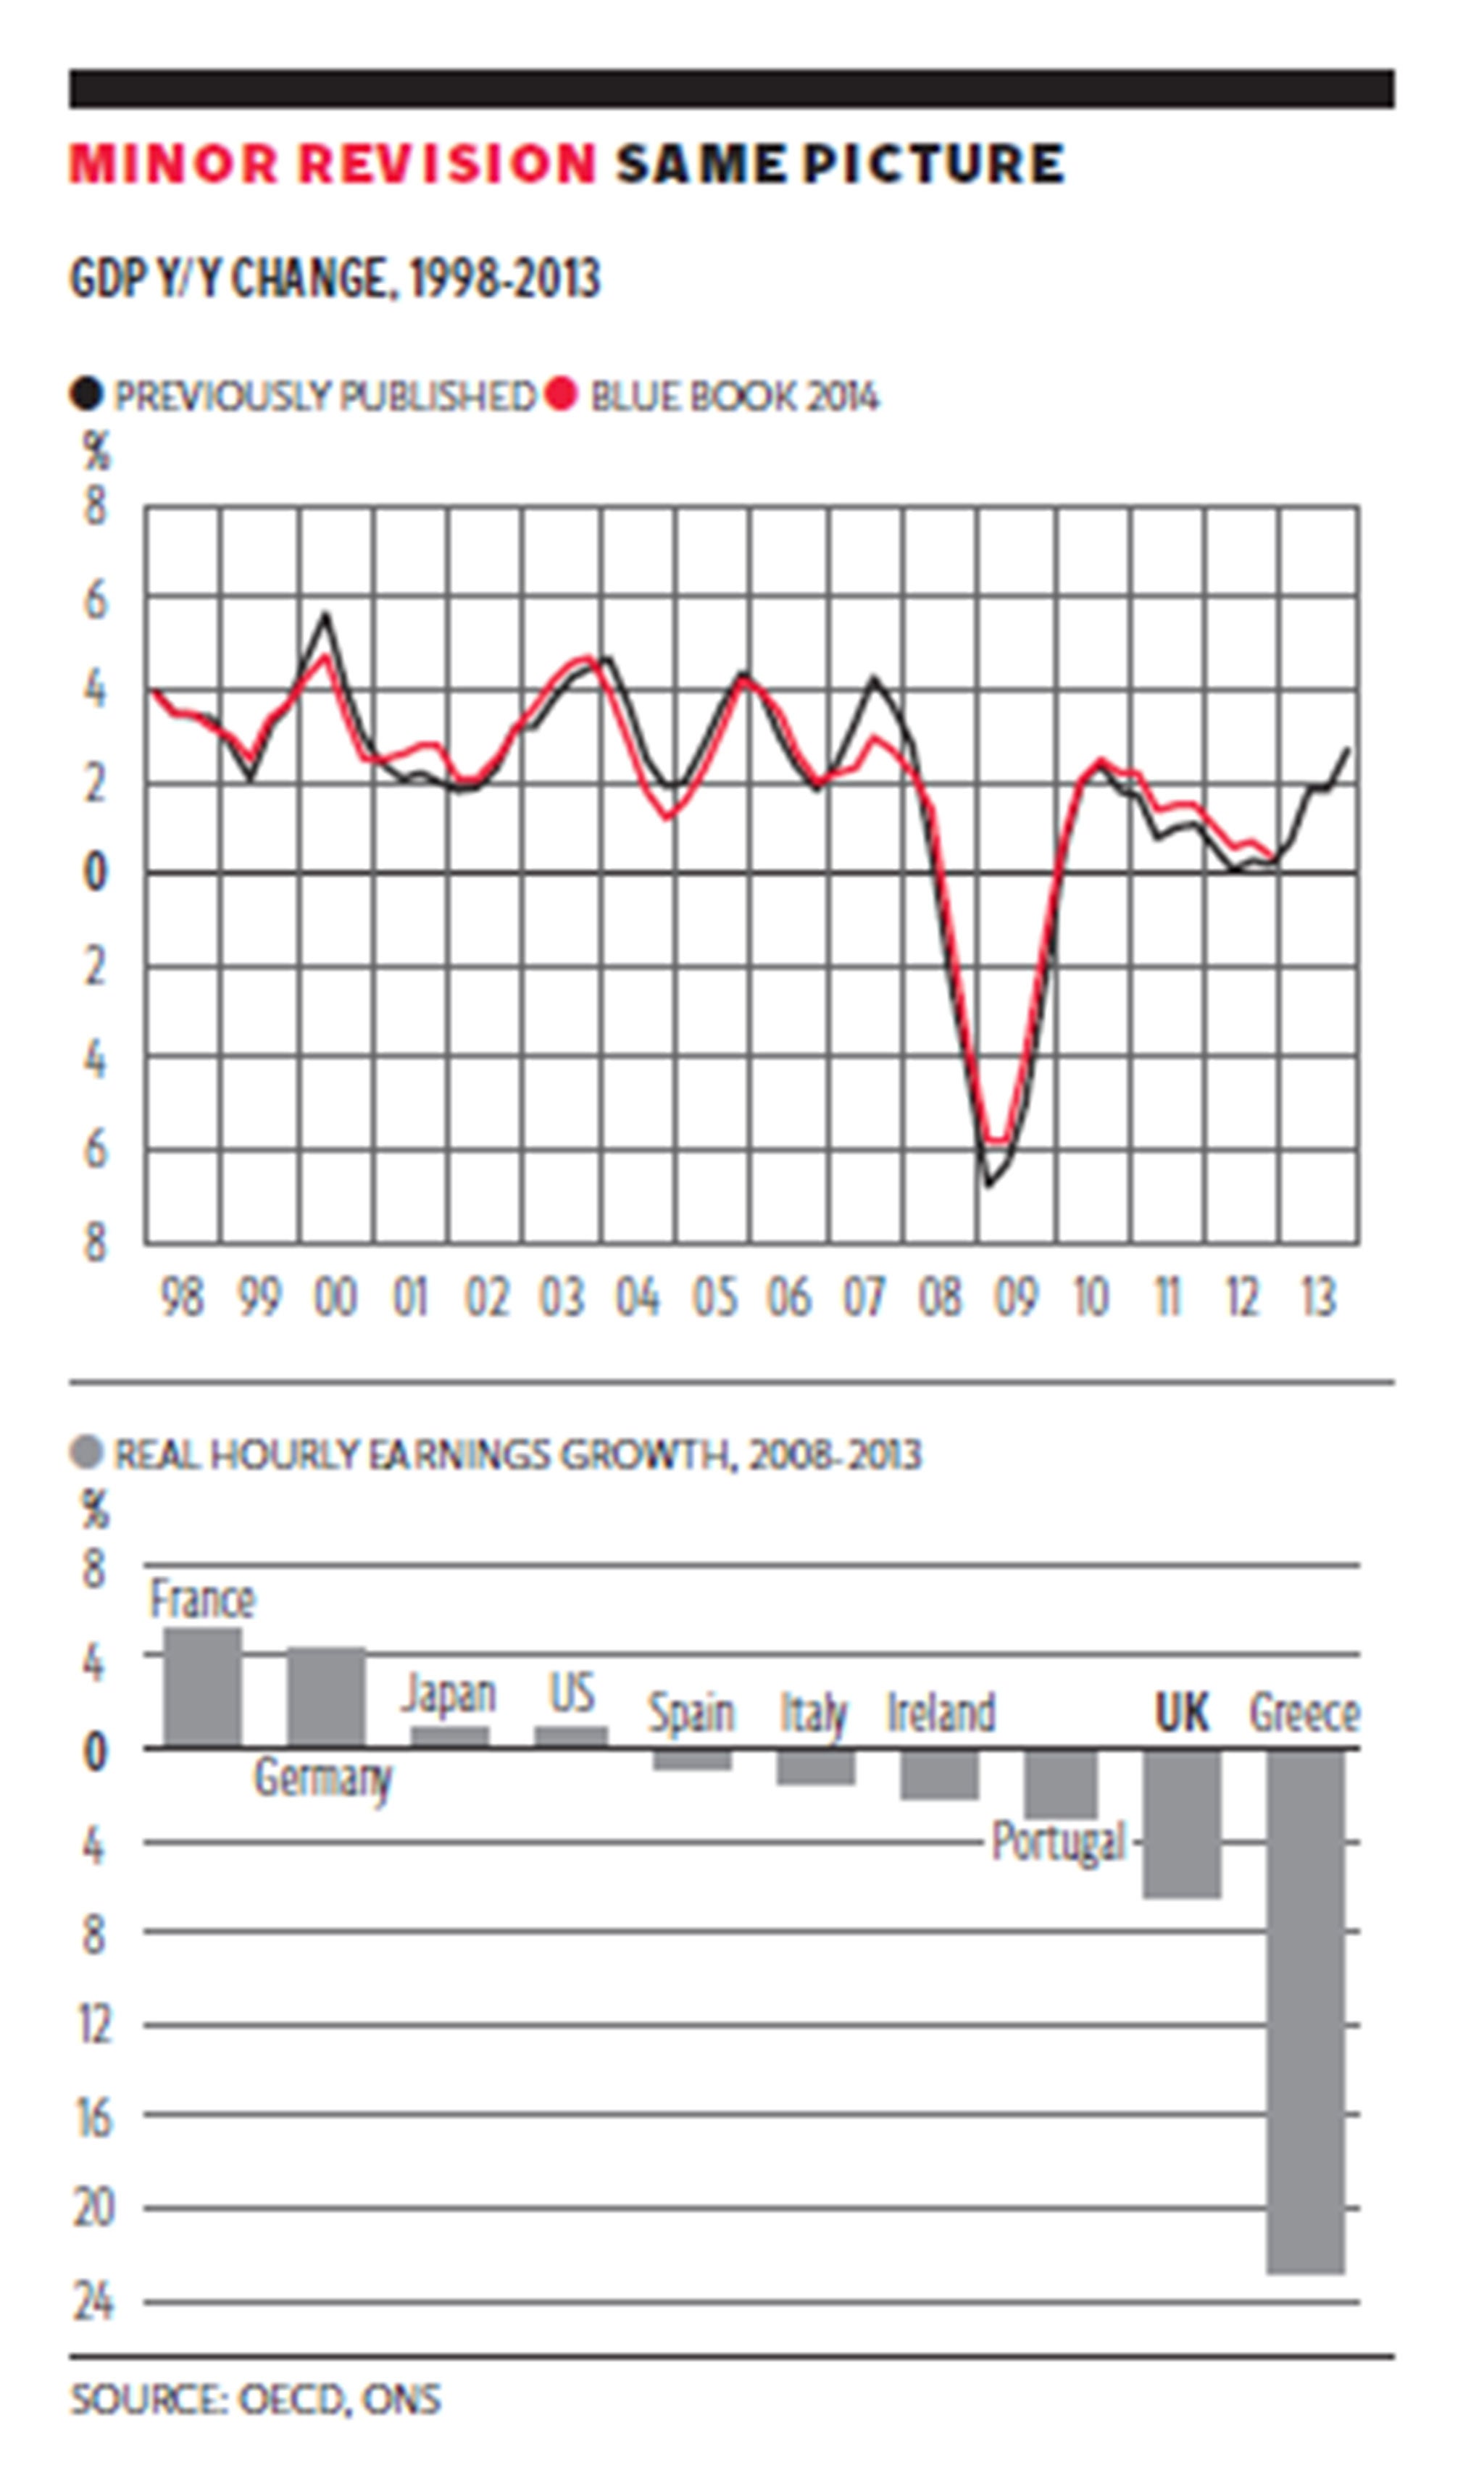
The first chart shows the path of growth with the previously published and the newly revised data from the 2014 Blue Book. It plots real GDP growth in a quarter compared to the same quarter a year earlier. In particular, the new quarterly path now includes lower estimates of real GDP growth during 2007, arising largely as a consequence of weaker investment growth and a weaker contribution from changes in inventories. GDP growth has been revised up in early 2009, due to a smaller downward contribution from changes in inventories, as well as an upward revision to investment growth over this period.
The chart makes clear that the economy was steadily emerging from recession that hit bottom in the first quarter of 2009 but then grew steadily until the Coalition took it over in May 2010. Growth then declined steadily through the end of 2012 before picking up again. Austerity killed growth. It also hit wages and earnings especially hard.
It is also clear from the data that the economy started slowing sharply in Q3 2007; I first started voting for rate cuts on the MPC in October 2007 and continued to do so at 18 meetings in a row through May 2009 when I left the committee.
Looking back to the November 2008 minutes this was pretty good. “There were also arguments in favour of a reduction in Bank Rate this month. The effect of earlier rises in interest rates on the commercial property and housing markets were now apparent and there was some evidence of a slowdown in activity. Pay growth remained muted.” Nobody expected the scale of the collapse in real earnings that followed.
The second chart uses data from the OECD 2014 Employment Outlook, published last week, to compare the total change in real earnings in 10 OECD countries. Over the entire six-year period real earnings in the UK fell by 6.5 per cent, and by 5.9 per cent between 2010 and 2012, and only Greece (minus 23 per cent) was lower. Real earnings growth was positive over this entire period in France (+5 per cent); Germany (+4 per cent); Japan (+1 per cent) and the US (+1 per cent).
Last week also saw the publication by the ONS of pay data from the Labour Force Survey (LFS), confirming the findings from the national statistic, Average Weekly Earnings (AWE), that real wage growth continues to fall rapidly under this government. According to the LFS, weekly earnings of full-time employees over the period April-June 2013 to April-June 2014 actually fell from £568 to £565 or by 0.6 per cent. In the private sector they fell by 1.5 per cent. Over the same period the CPI rose by 1.7 per cent, while the RPI grew 2.5 per cent. So real earnings have fallen by between 2.3 per cent and 3.1 per cent on the year, depending on which deflator is used. Since May 2010 LFS mean weekly earnings of full-time employees is up 4.4 per cent while the CPI is up 11.9 per cent and the RPI is up 14.4 per cent.
So real earnings are down between 7.5 per cent and 10 per cent since the Coalition took office, depending on which deflator is used. This is unprecedented. There is no chance this real earnings fall will be restored by the May 2015 election or that real wage growth will have even turned positive by then.
In a speech to the American Enterprise Institute in Washington DC on 11 April 2014 the Chancellor, George Osborne, said: “The pessimists said our plan would not deliver economic growth. Now they say economic growth will not deliver higher living standards.” We were right.
*Andrew Walton, “Changes to National Accounts: Impact of National Accounts improvements; International Comparisons”, ONS, July 2014
Join our commenting forum
Join thought-provoking conversations, follow other Independent readers and see their replies
Comments
Bookmark popover
Removed from bookmarks