How long will shareholders be pursued by this bear market?
Economic View
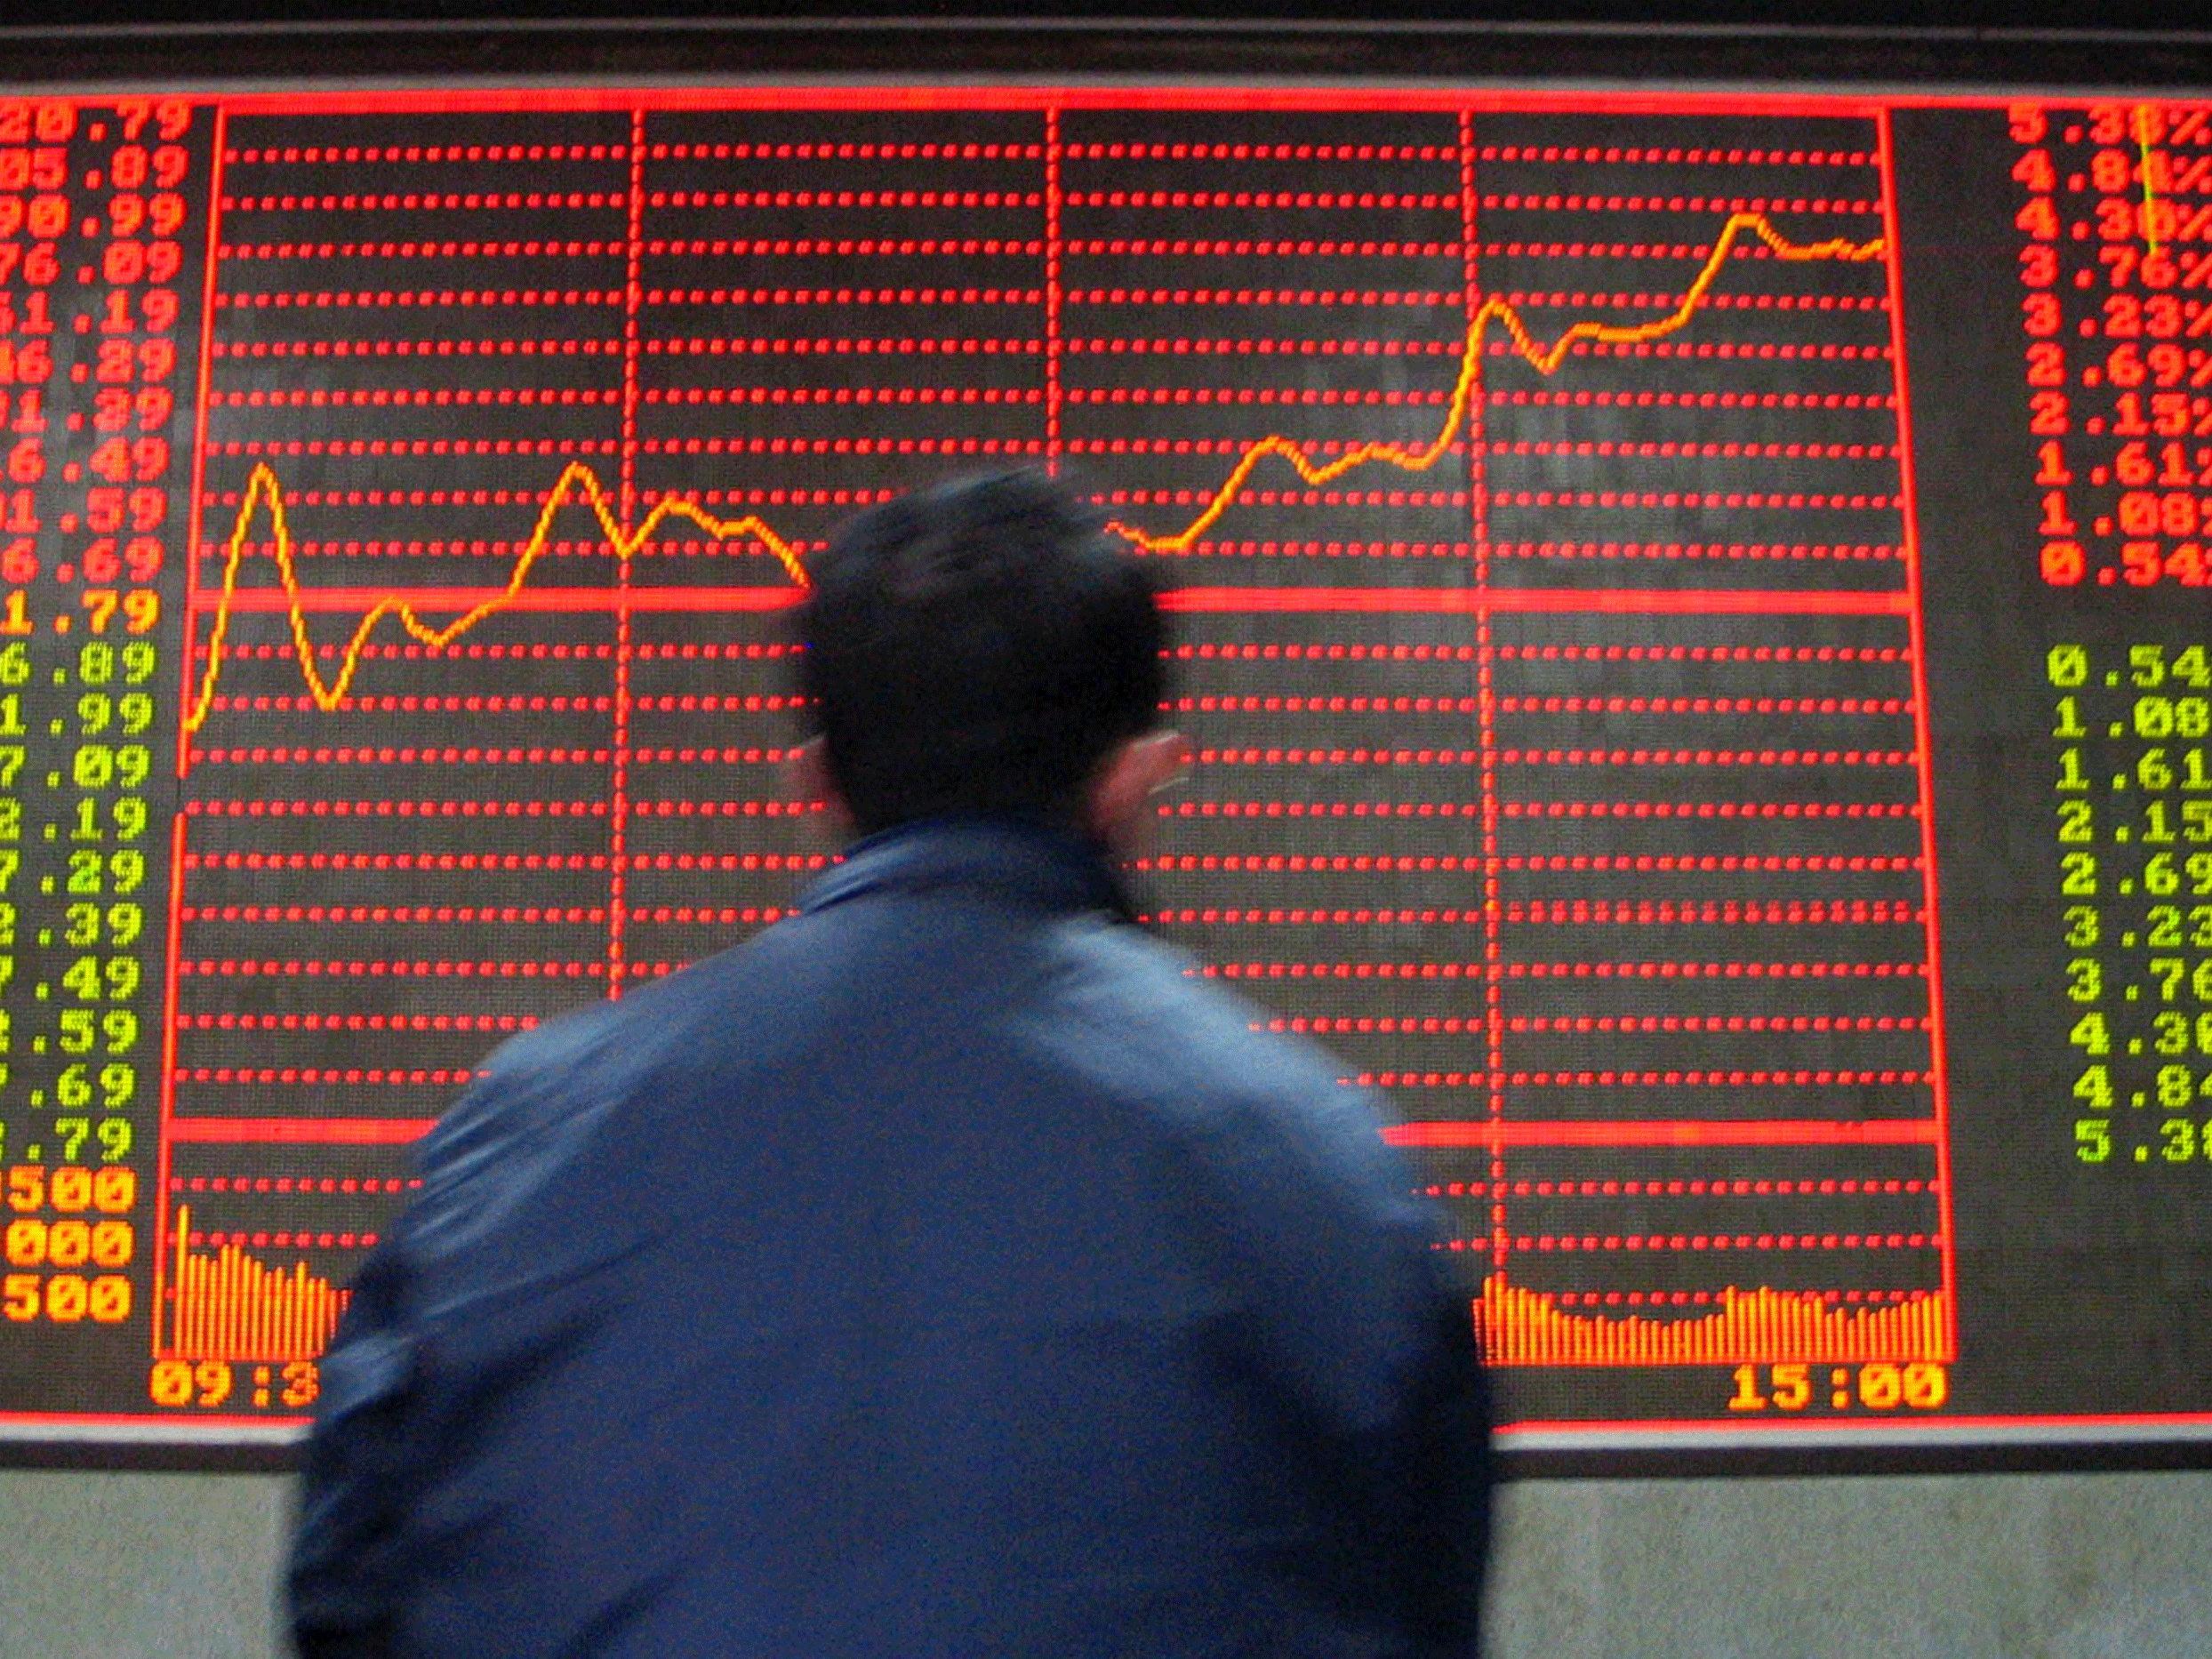
The mood is shifting again. Until a week or so ago, as fears mounted, the big question for equity market strategists was how bad might the present bear market be. Whether it is indeed a full-blown bear market or a “bull correction” – that cute expression for share prices not quite falling far enough to qualify as a bear market – depends on where you look. Technically, a bear market is when the index in question falls by 20 per cent from its peak. US shares, as measured by the S&P 500 did not get there and have recovered a bit. UK shares, taking the FTSE 100 as the marker, did dip into bear territory, particularly so if you factored in the fall of sterling too. As for the emerging markets, there has certainly been a clear bear market.
But – and this is where the shift is starting to happen – bear markets do not last for ever. So people are starting to ask how long, on historical precedent, this one might be likely to last, and how fast might the snap-back be. Morgan Stanley, the investment bank, has looked at more than 40 bear markets and corrections since 1961 and worked out the median declines and the number of days between the peaks and the troughs. The results for the S&P 500 are shown in the graphs.
First, the decline. As you can see, the greatest fall, peak to trough, was the one associated with the great financial crash, when US shares fell by 57 per cent from their peak on 9 October 2007 to the trough on 9 March 2009. That sets the outer limits of post-Second World War experience. The next worst bear markets were those associated with the first oil shock, from January 1973 to October 1974, when shares fell by 48 per cent; and the popping of the dotcom bubble, from March 2000 to September 2002, with a fall of 40 per cent.
However, in duration the 2007-9 decline was not particularly long: 17 months, or 370 business days. The longest decline was the post-dotcom one, which lasted for two-and-a-half years, or 643 business days. The second longest was after the oil shock, when shares fell for more than 20 months, or 451 business days.
So what, on this analysis, is a “typical” bear market? And what implications are there for the present experience? It depends a bit on whether you include corrections – that is falls which do not exceed 20 per cent – but if you do, the median decline for the S&P is 28 per cent. The median duration of the decline is 272 days. So if US shares are indeed in a typical bear market, they have a long way to go both in the decline and the duration. On my tally, the S&P fell by “only” 13 per cent between its peak last May and the lows earlier this month, and the fall so far has lasted only eight months. But this may not be a true bear market; it may just be a correction. Would that we knew.
That is US experience. What about the rest of the world? Japanese bear markets last the longest, not surprisingly so given the overall performance of both the economy and asset prices in general over the past 30 years. Shares have yet to regain their all-time peak on 29 December 1989, when the Nikkei 225 index closed at 38,916. On Wednesday, after rather a strong day’s trading, it stood at 17,164. But Japan is the outlier. The median decline of the FTSE 100 is 38 per cent peak-to-trough and the period of decline is 189 working days. And for emerging markets, the median fall is 31 per cent and the period of decline 121 working days.
This gives mixed signals for the UK. On past form, the FTSE 100 index should have some way to fall, but the duration of decline is now quite mature for the peak was last May, so an upturn could be in sight. The clearest signal is for the emerging markets, which should be ready for a turnabout: their fall so far is 35 per cent and they have been falling for 362 business days, a lot worse than the median on both counts. But to be quite clear, no cycle is the same, as you can see from the charts of US experience. Sometimes you get a nasty crash, which is quickly reversed, as in 1987. And sometimes you get a long, slow, bitter march down, as has happened in Japan.
What should we make of all this? There are a couple of general points that need to be repeated at a time like this. One is that the connection between equities and the real economy is tenuous. Ultimately, companies thrive only if they face profitable demand for the goods and services they produce and, if they are profitable, some of that profit will be passed to shareholders. But the valuation markets put on that flow of profit vary vastly. You can get a bear market in a period of strong growth in demand.
The second is that while no cycle is the same, there is such a thing as the cycle. Neither markets nor the real economy can escape. We know there will be a market recovery, just as we know that at some stage there will be another economic downturn. What is interesting now is that data in the US are now looking rather softer than they were a few months ago. It would be well within past experience for there to be a cyclical slowdown in the next couple of years.
But there is also a third specific point. It is that if analysts at Morgan Stanley are focusing on how the present difficult equity market looks through the lens of past experience, they reflect a changing mood. The mood is shifting from fretting about the trench warfare in the markets now to taking a strategic view of the opportunities beyond. The trouble is, none of us can know whether those opportunities are just round the corner, or whether there is a tough summer and autumn ahead.
Join our commenting forum
Join thought-provoking conversations, follow other Independent readers and see their replies
Comments
Bookmark popover
Removed from bookmarks