Latest official UK inflation figures explained and why they are not what they seem
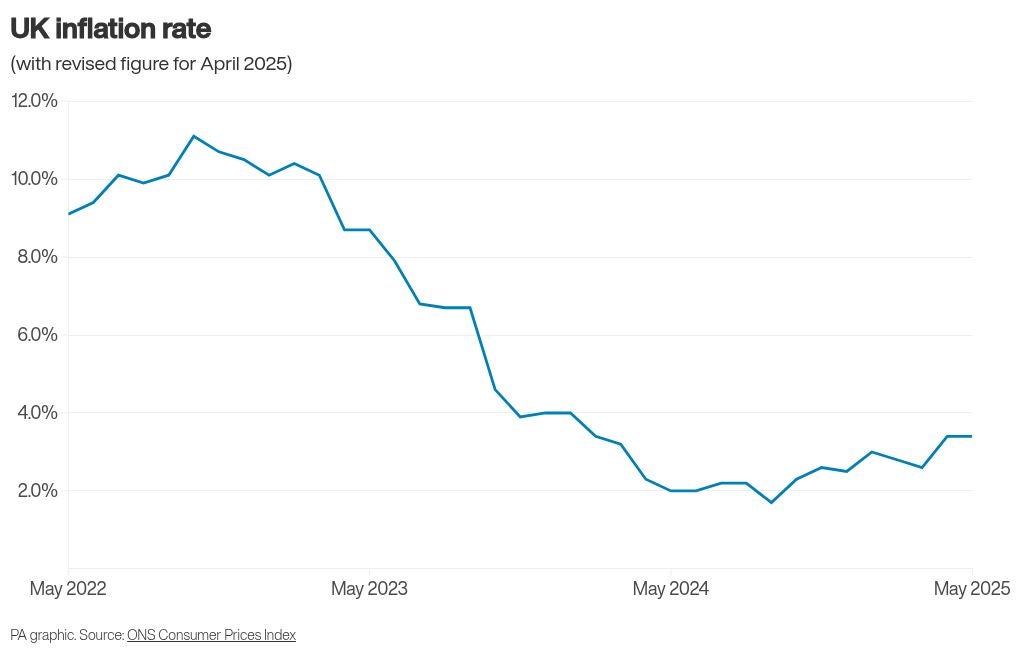
Inflation in the UK had been dropping, having reached a high of 11.1 per cent in October 2022

New figures suggest the UK’s rate of inflation has dipped, yet official data has revealed a minor calculation error
The Office for National Statistics (ONS) initially stated on May 21 that the Consumer Prices Index (CPI) for April was 3.5 per cent.
However, on June 5, the ONS corrected this figure, confirming the actual rate was 3.4 per cent.
This discrepancy arose due to an error in the calculation of vehicle excise duty (VED) data provided by the Department for Transport.
Despite the reported easing of inflation from 3.5 per cent in April to 3.4 per cent in May, the actual inflation rate remained unchanged at 3.4% for both months.
This data had overstated the number of vehicles subject to VED – which in turn led to the ONS overstating April’s overall rate of inflation by 0.1 percentage points, reporting it to be 3.5 per cent instead of 3.4 per cent.
But while April’s rate is now known to have been wrong, the ONS has a policy of not revising official inflation figures in subsequent publications.
This is why, in the inflation data published on Wednesday, the ONS said April’s inflation rate was 3.5 per cent, not 3.4 per cent – and why its figures suggest inflation eased month on month, instead of what actually happened, which is that it remained at 3.4 per cent.
April’s inflation figure will continue to be stated by the ONS as 3.5 per cent, despite it actually being 3.4 per cent.
Bookmark popover
Removed from bookmarks