UK poverty: Six charts that show the true state of low income Britain
Persistent poverty rates have fallen in Britain, but thanks to Government welfare cuts the overall trend is still bleak
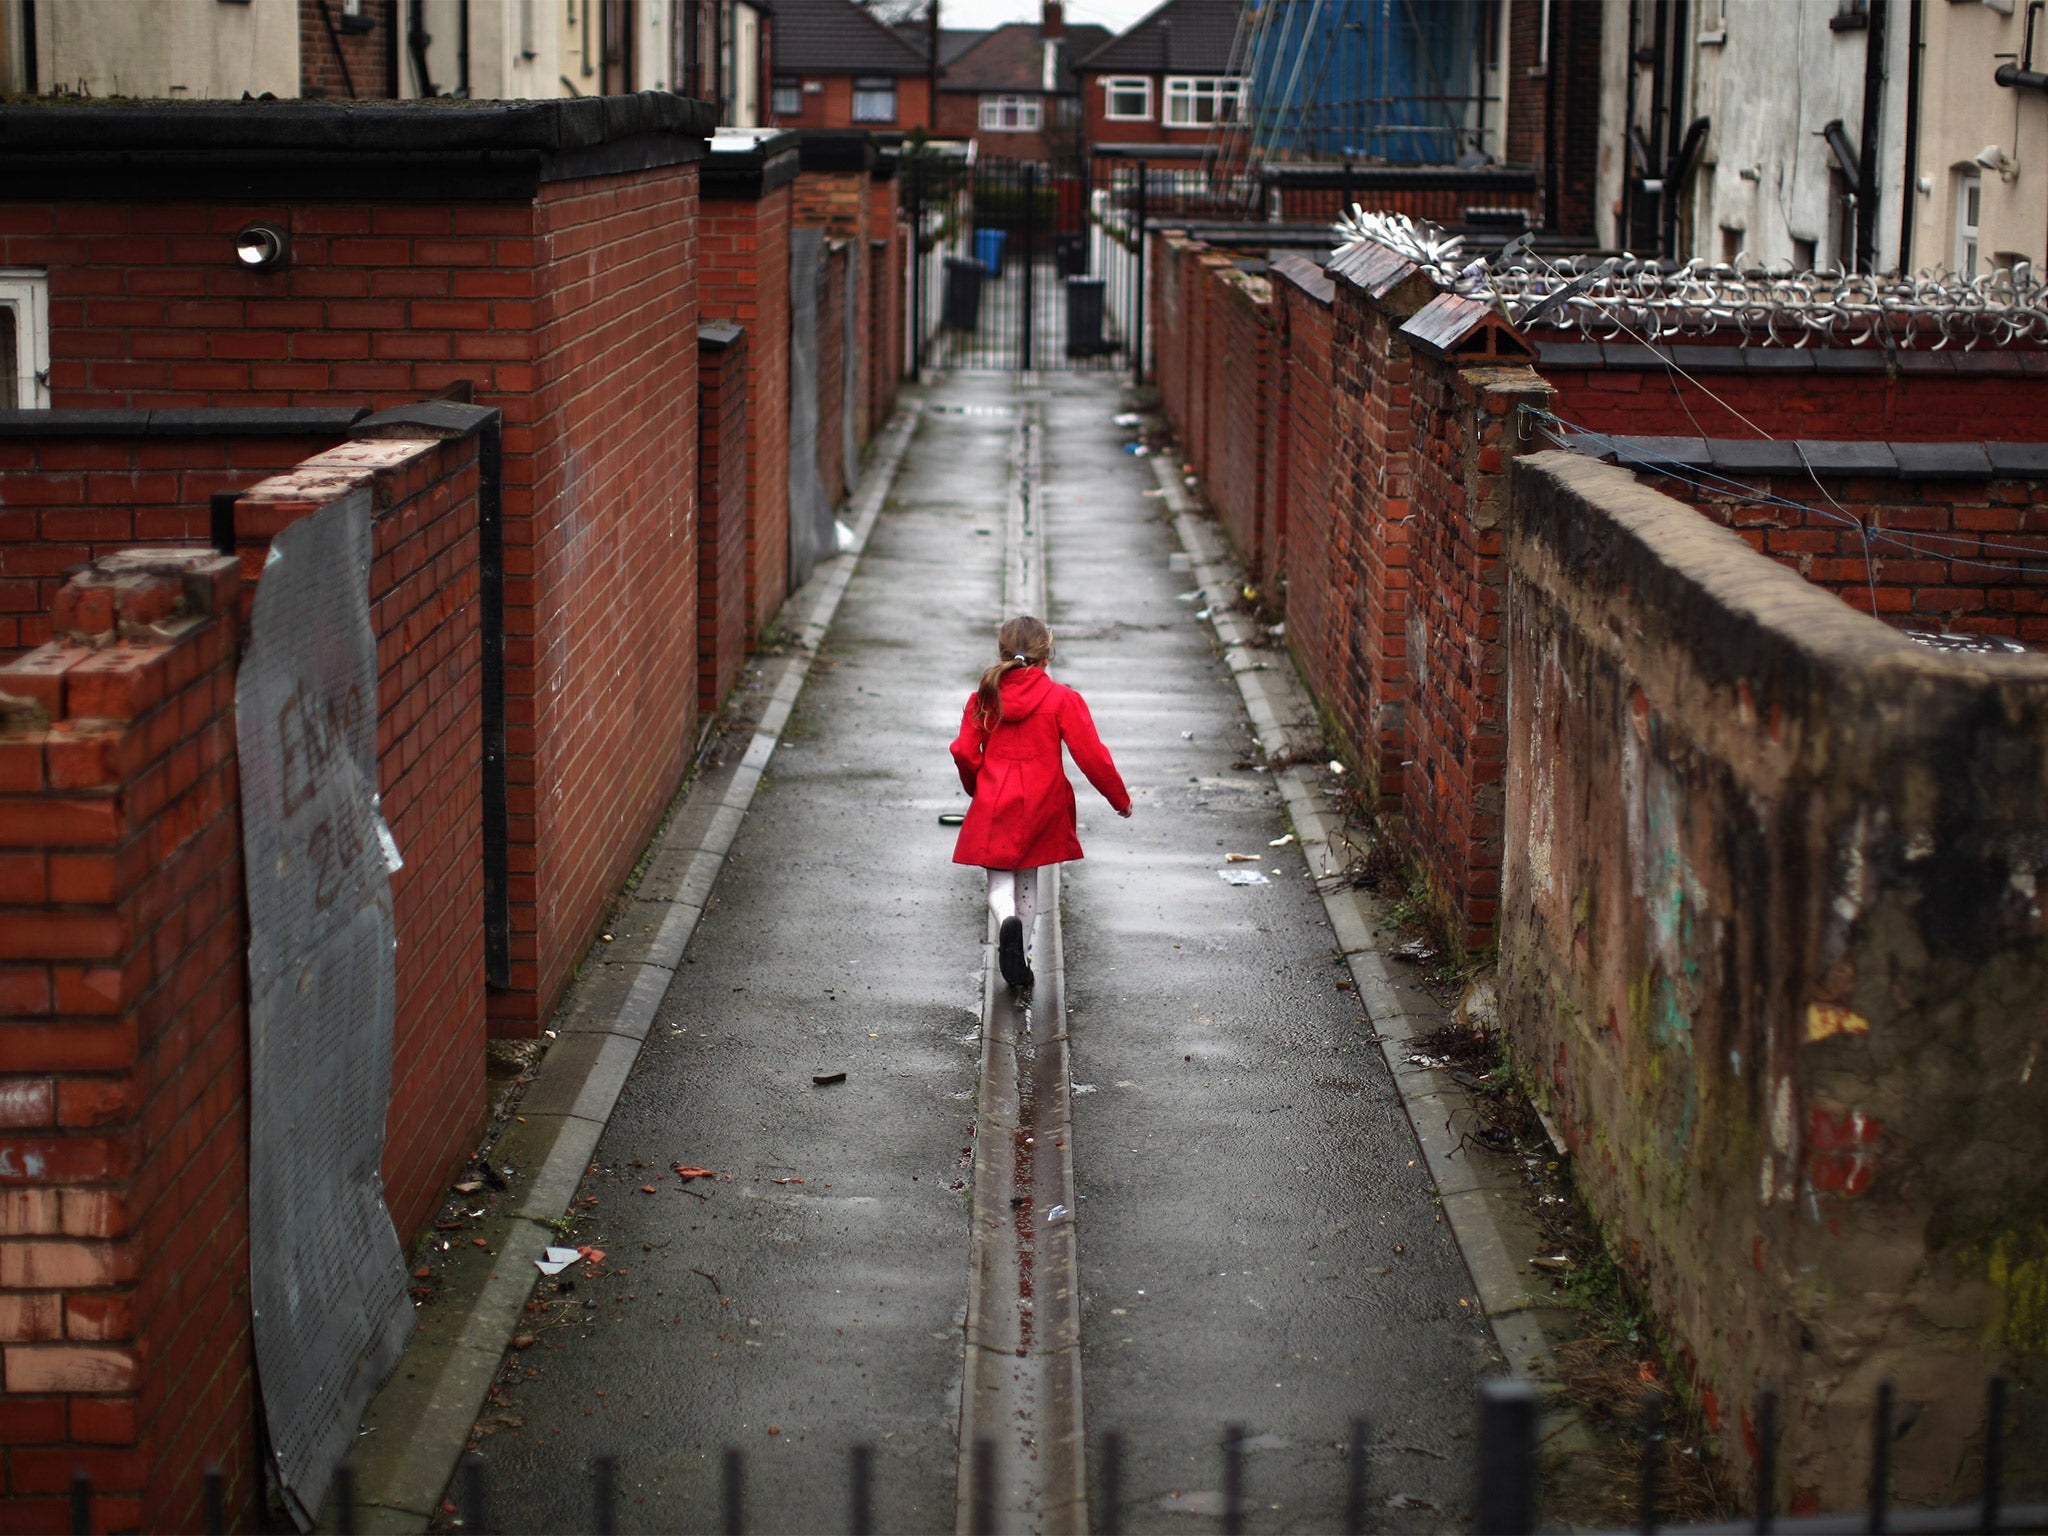
The UK has 3.9 million people in "persistent poverty" according to a report released from the Office for National Statistics today.
Persistent poverty is defined as people who are in relative low income (less than 60 per cent of the national median average) in the current year and at least two out of the three preceding years.
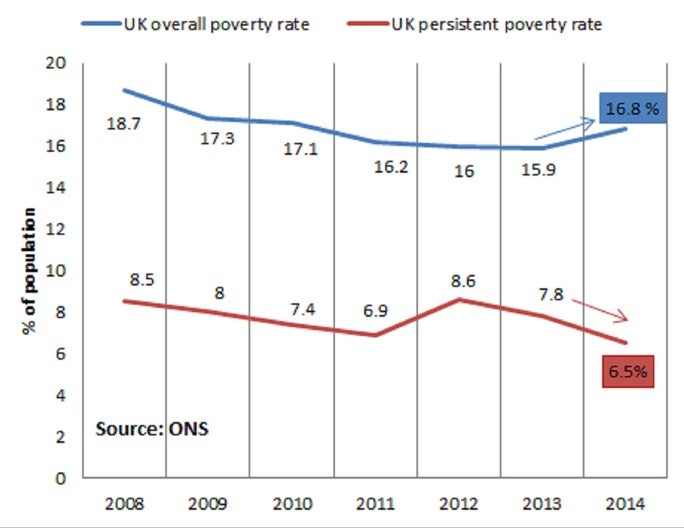
The overall poverty rate rose between 2013 and 2014 from 15.9 per cent of the population to 16.8 per cent.
But the persistent poverty rate fell from 7.8 per cent to 6.5 per cent:
POVERTY: UP AND DOWN
The UK overall poverty rate compared to the rest of the European Union is quite high:
OVERALL POVERTY RATES IN THE UK ARE RELATIVELY HIGH...
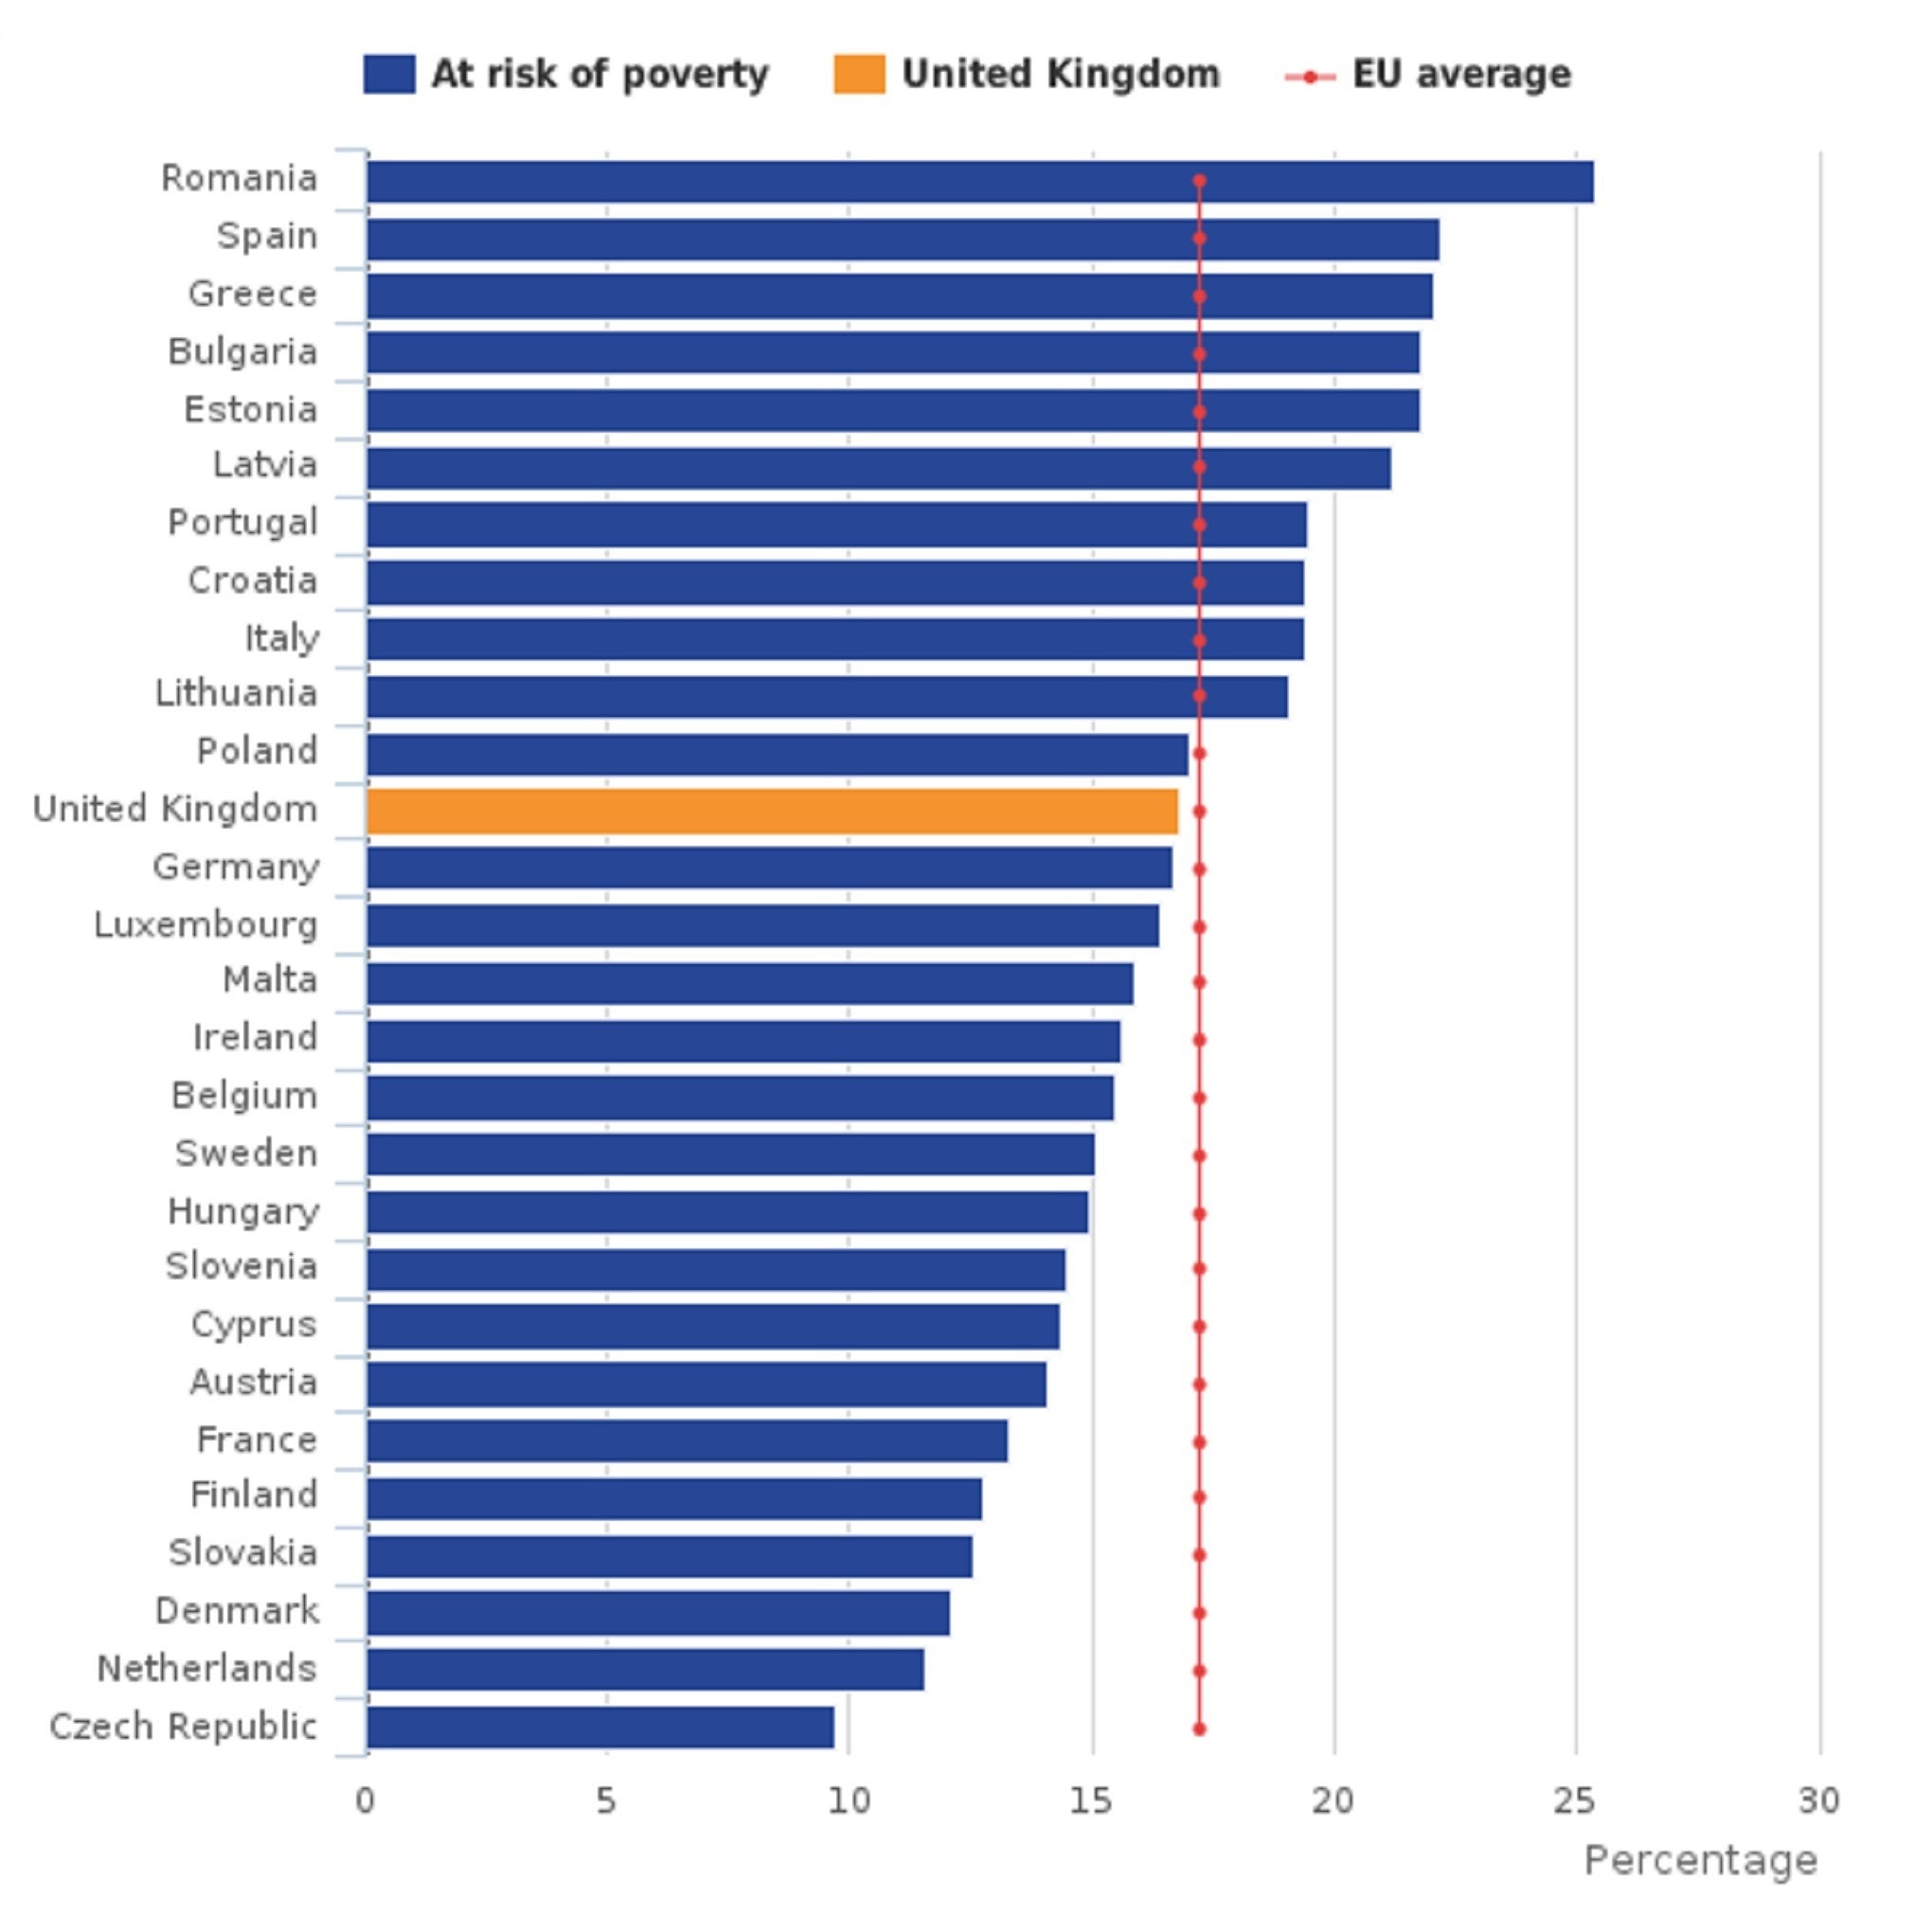
The rate is higher than in several other high income states such as Germany, Ireland, France, Finland and Sweden
Yet the rate of persistent poverty is low relative to our European peers:
...BUT PERSISTENT POVERTY RATES IN THE UK ARE RELATIVELY LOW
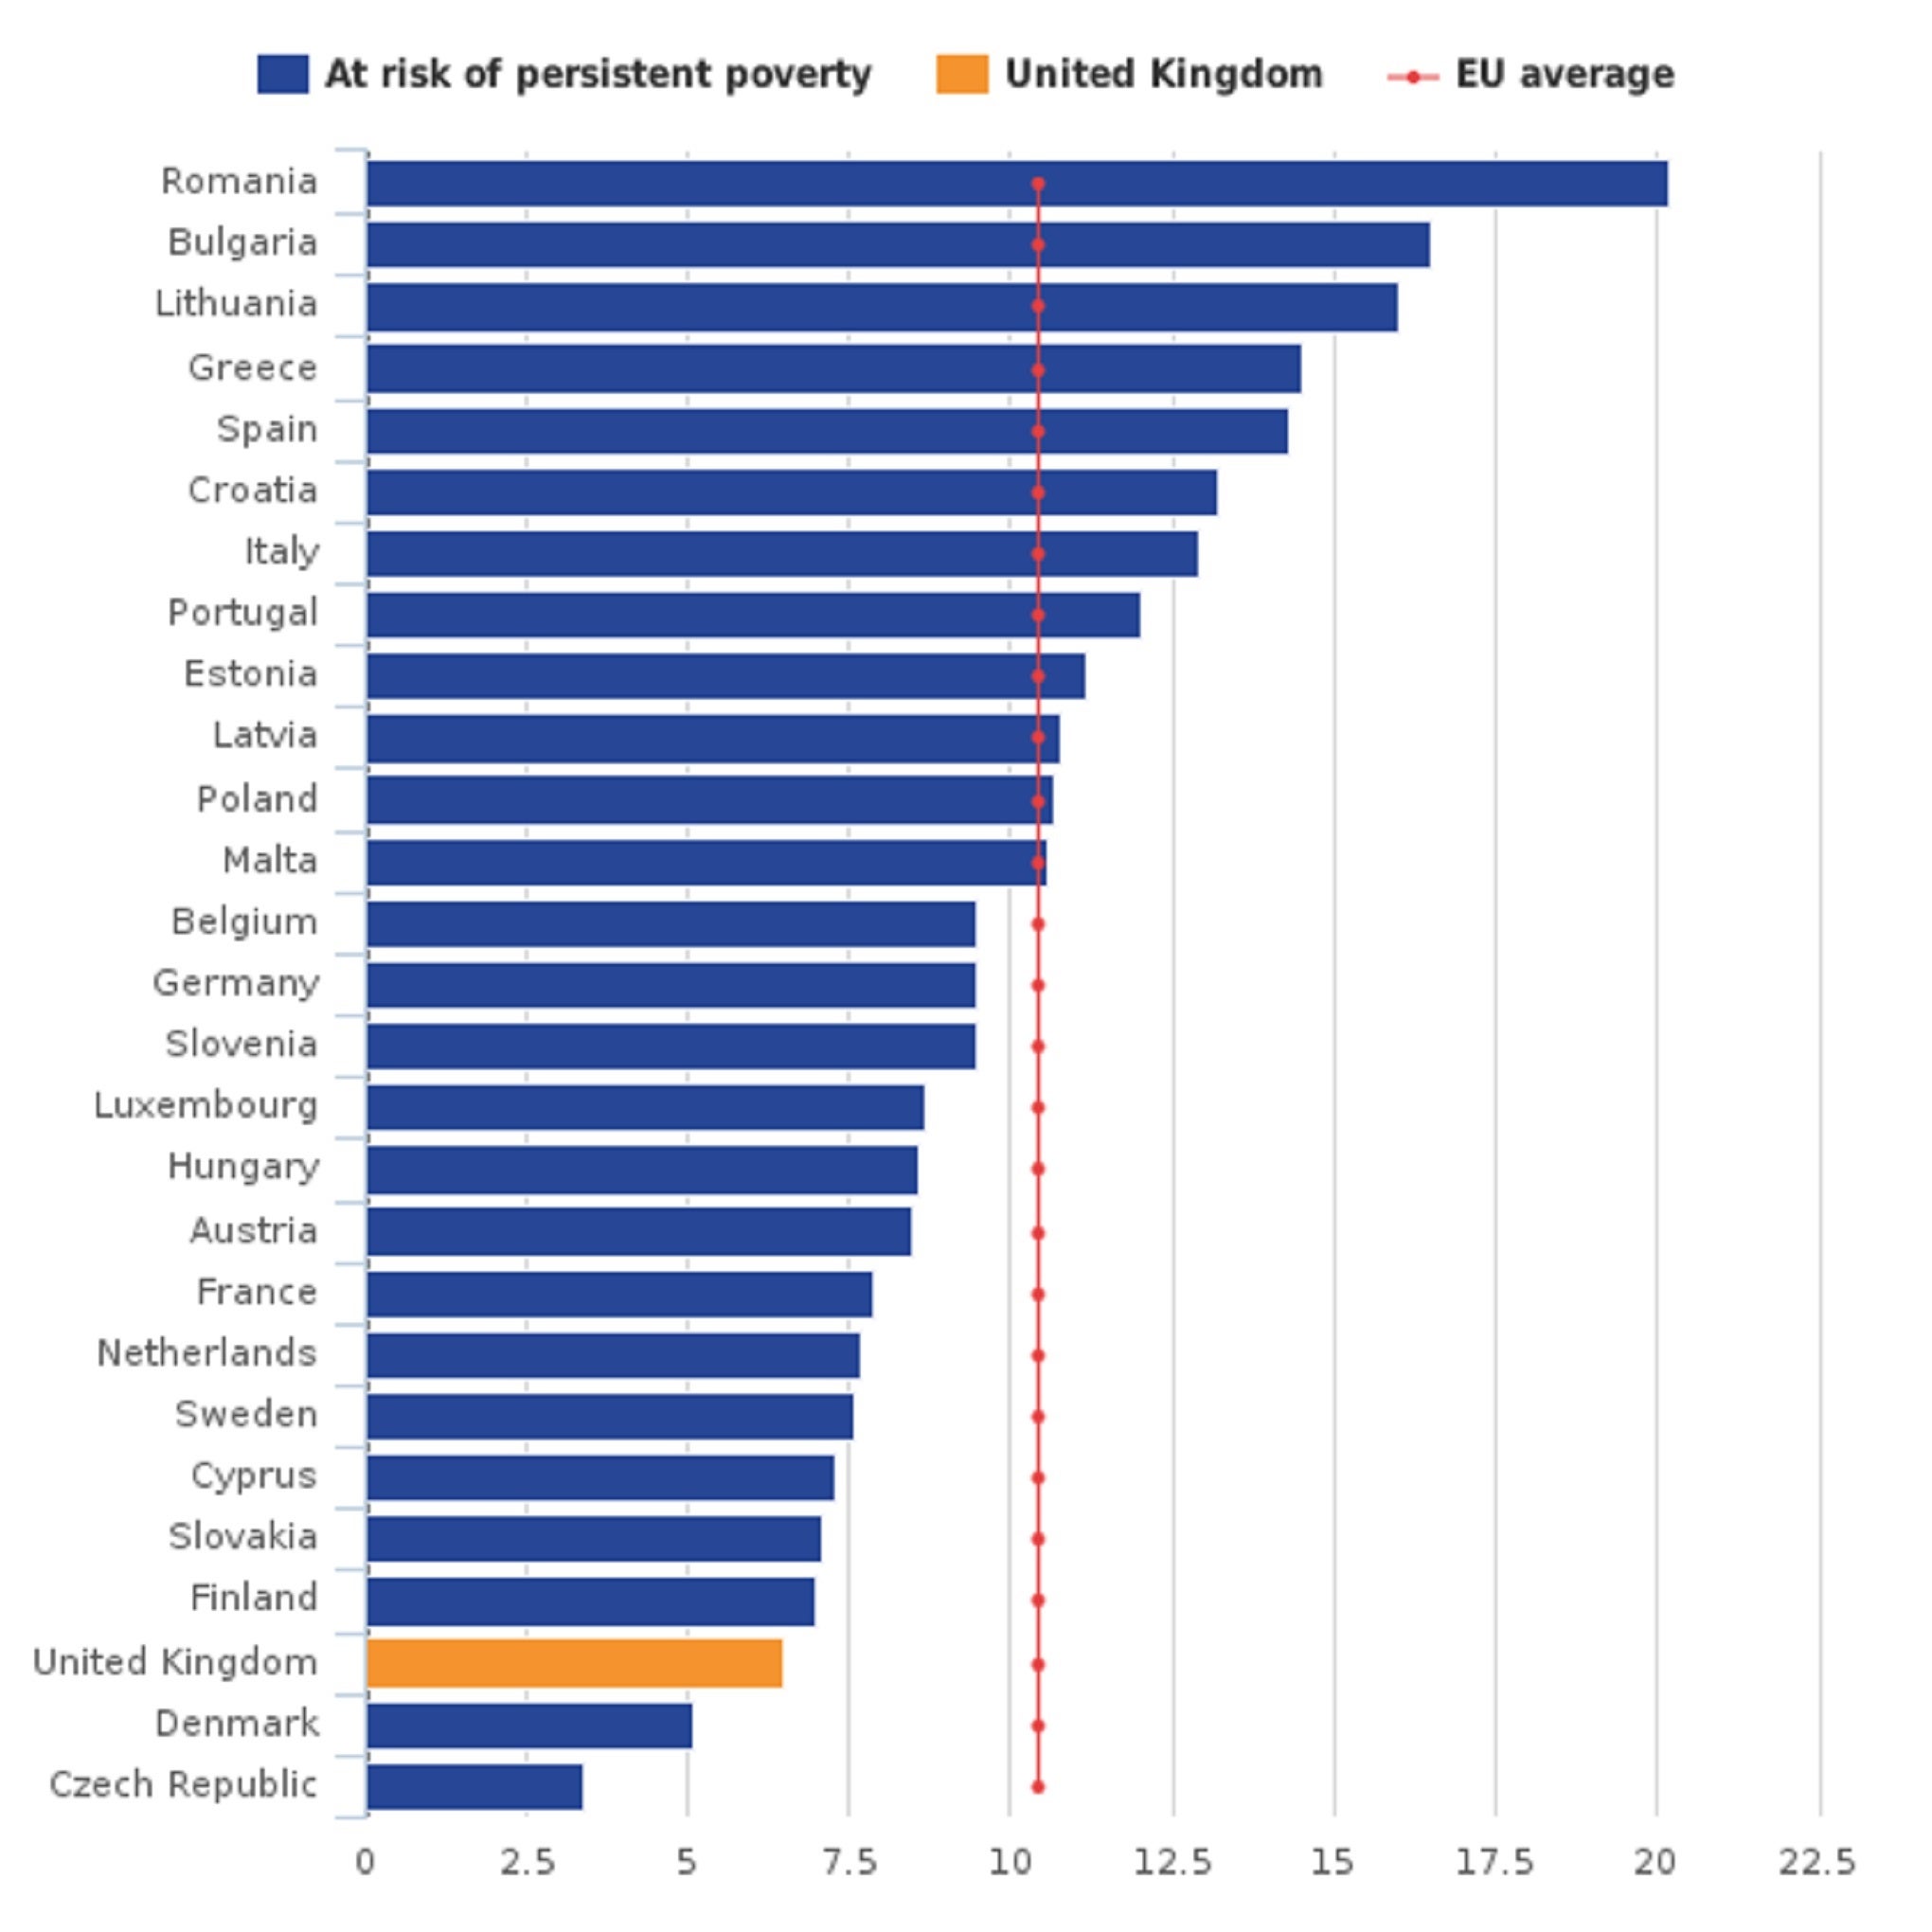
Only in Denmark and the Czech Republic is it lower.
So how should we interpret these figures?
Of course it's good news that persistent poverty seems to be relatively low and falling. But overall poverty also matters. And as we can see that's moving in the other direction.
And forecasts by the Institute for Fiscal Studies suggest that the Conservatives' tax credit cuts are going to push overall poverty rates much higher over the rest of the Parliament. The IFS sees the overall rate rising by around 2 percentage points by 2020-21. Moreover, the child poverty rate is set to explode from around 17.5 per cent to 25 per cent over that period:
THINGS ARE GOING TO GET WORSE ON POVERTY...
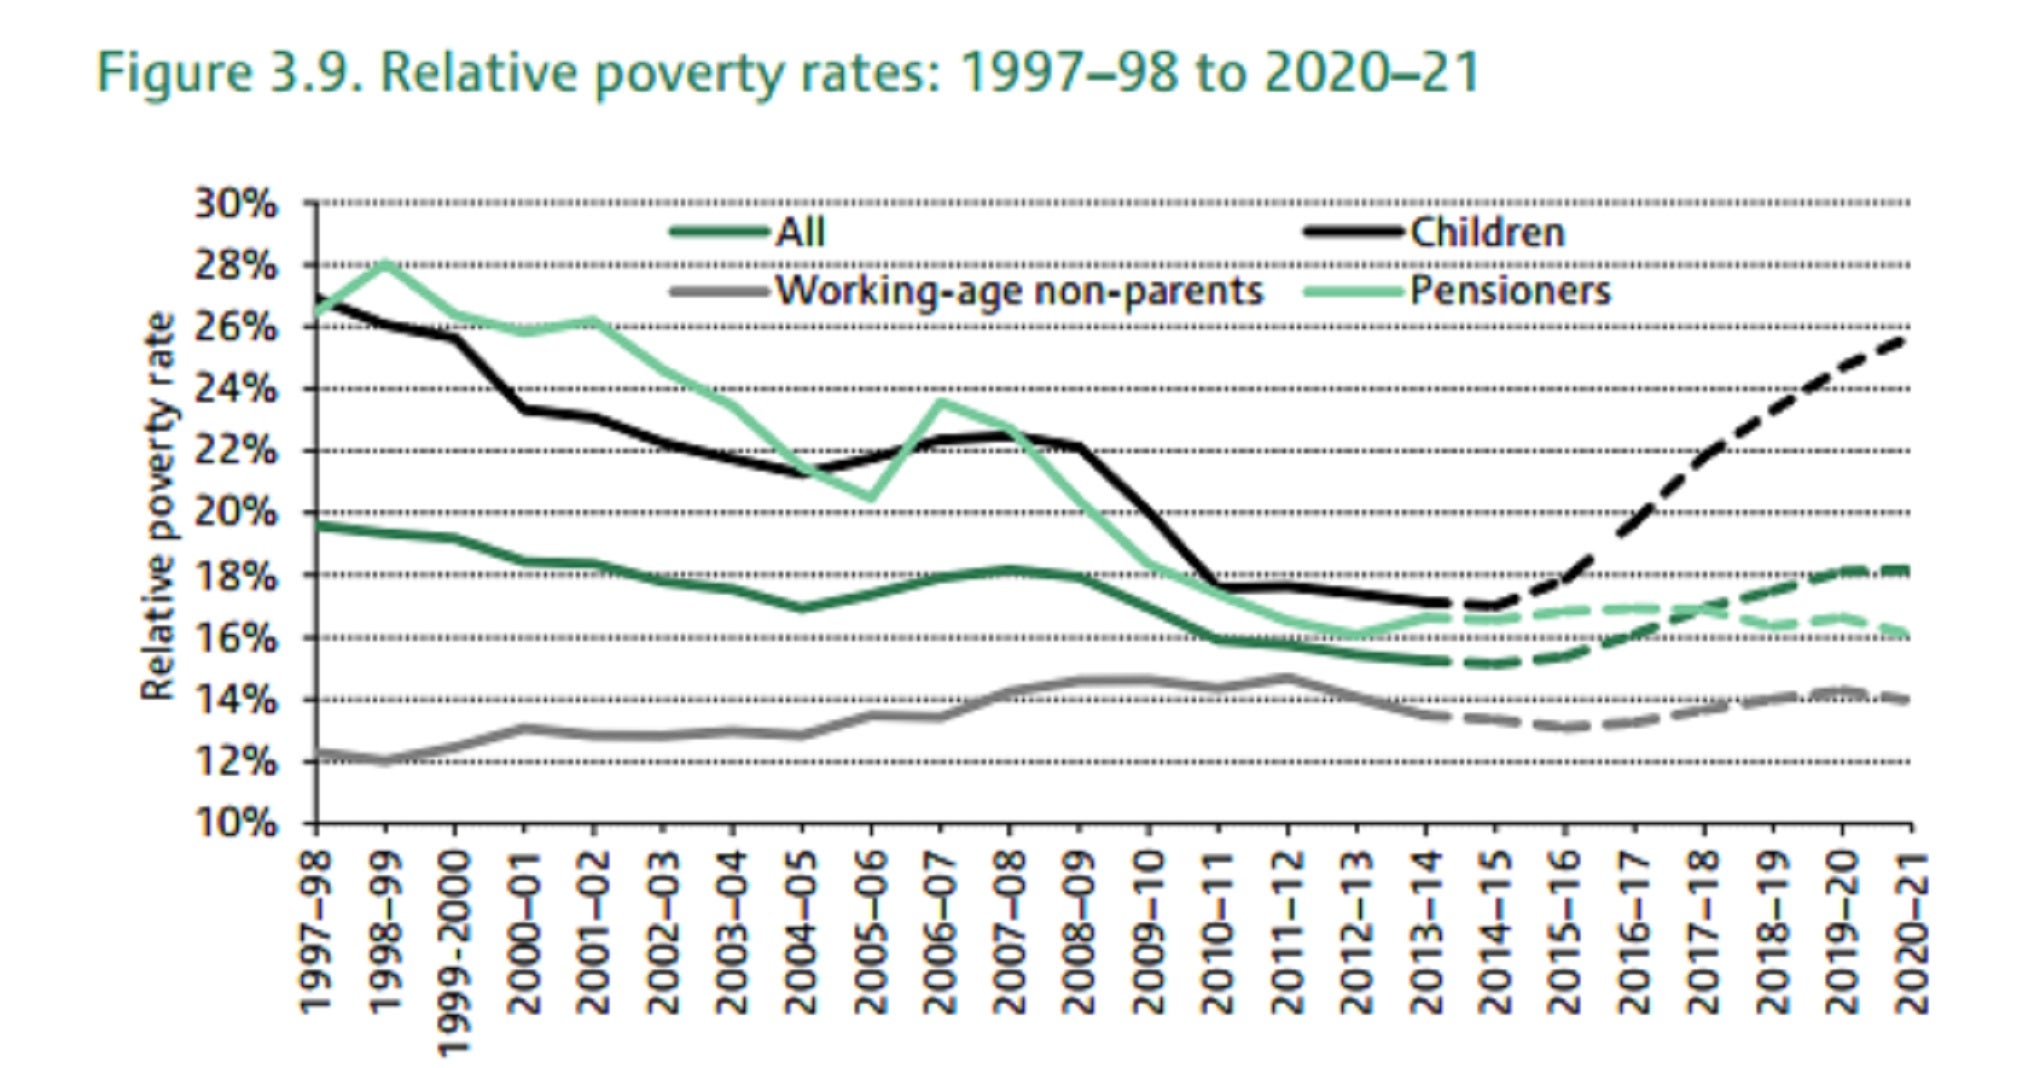
This is largely due to the cuts in tax credits for women with more than two children. All the hard work in pushing down the child poverty rate under the Labour government after 1997 looks set to be reversed.
And bear in mind that the 2010 Child Poverty Act, passed with cross-party support, set a target of reducing relative poverty to less than 10 per cent of children by 2020.
Barring a miracle that will be missed by a country mile.
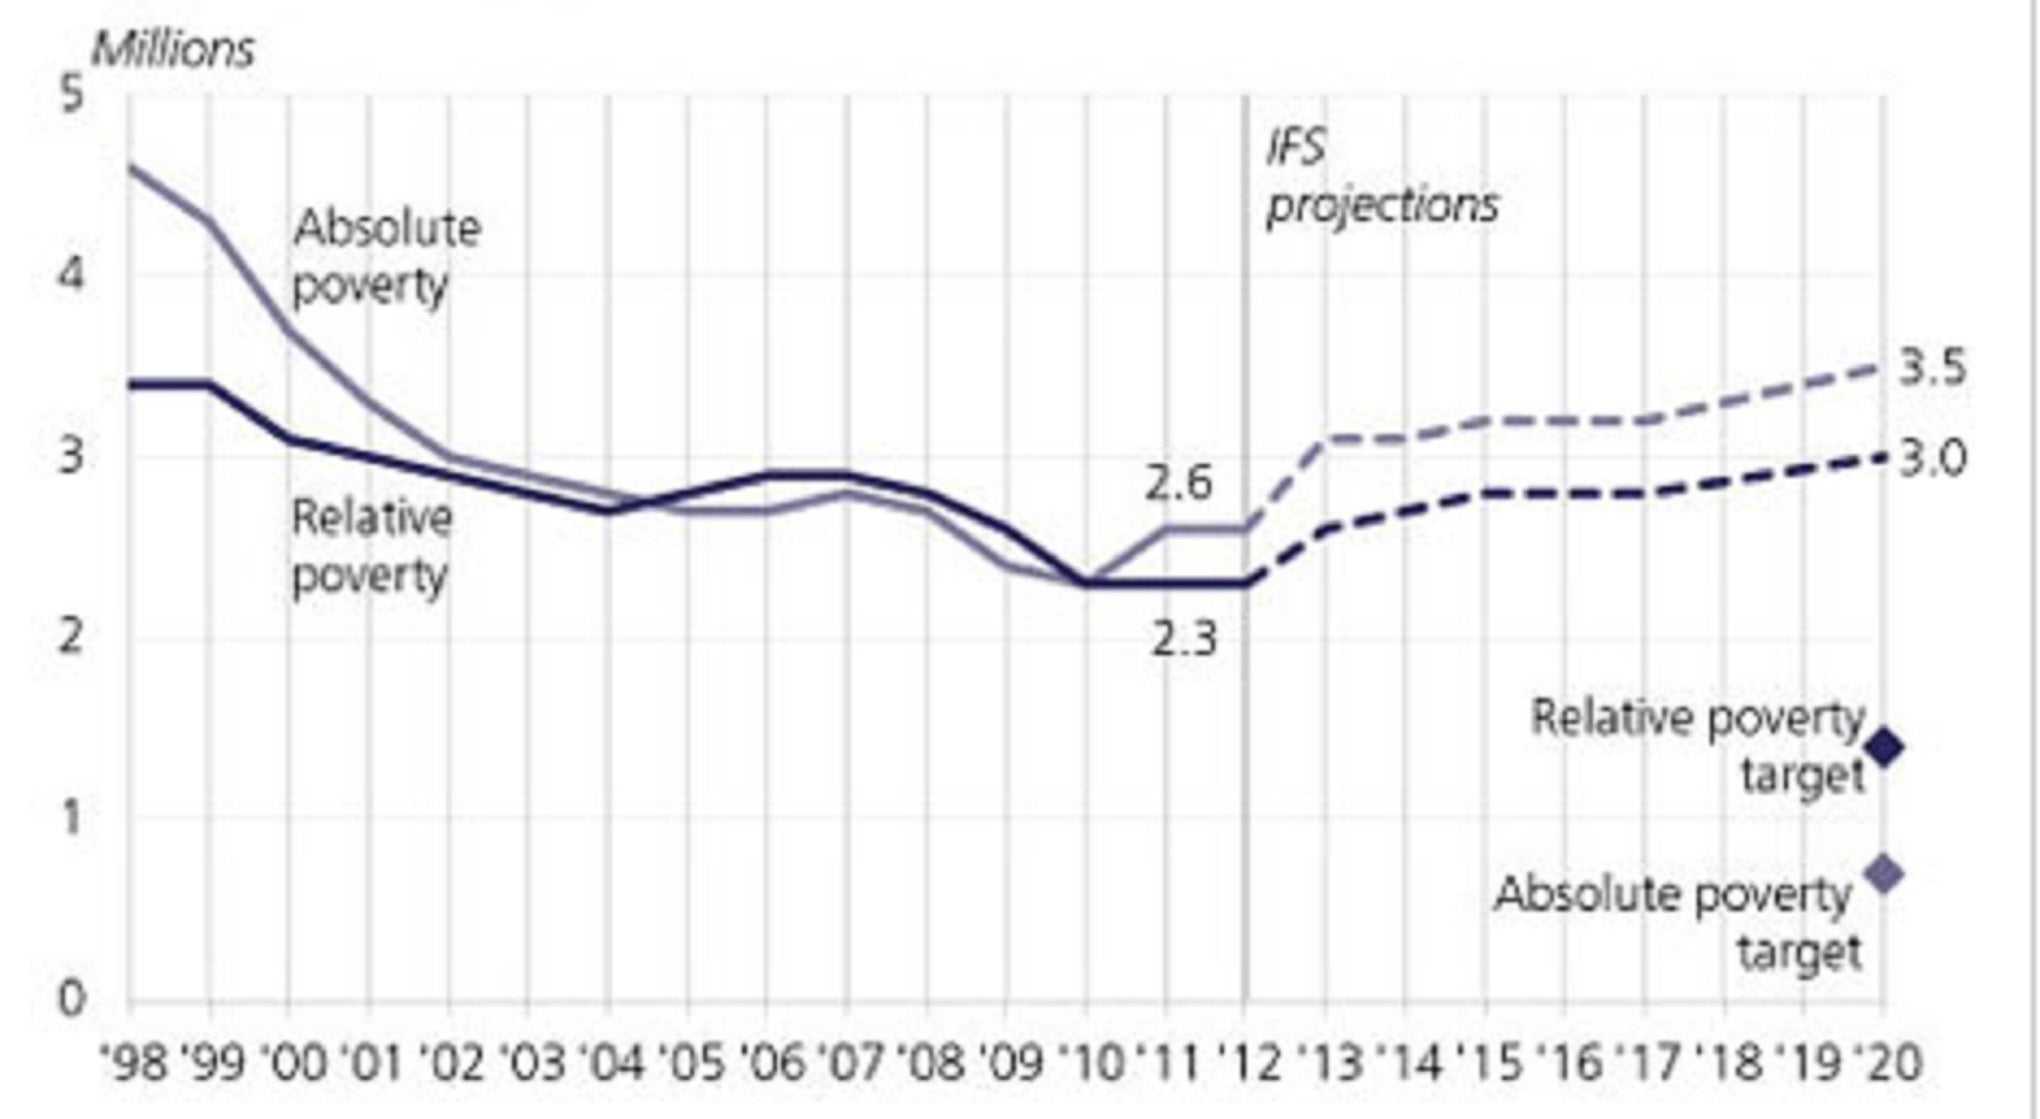
And let's think about child poverty in numbers of children living below the poverty line, rather than in rates.
The official target implied this falling from 2.3 million in 2012 to around 1.25 million by 2020. Instead, the number of children in relative looks set to jump to 3 million by the end of the decade:
...AND OFFICIAL TARGETS WILL BE MISSED
UPDATE:
I asked the ONS if they had any data on persistent poverty rates in children.The Coalition Government consulted on a 7 per cent target for this metric. The ONS sent me data showing that between 2011 and 2014 (three year period) the rate of persistent child poverty rose to 11 per cent, up from 10.1 per cent in the previous period:
....PERSISTENT CHILD POVERTY RISING
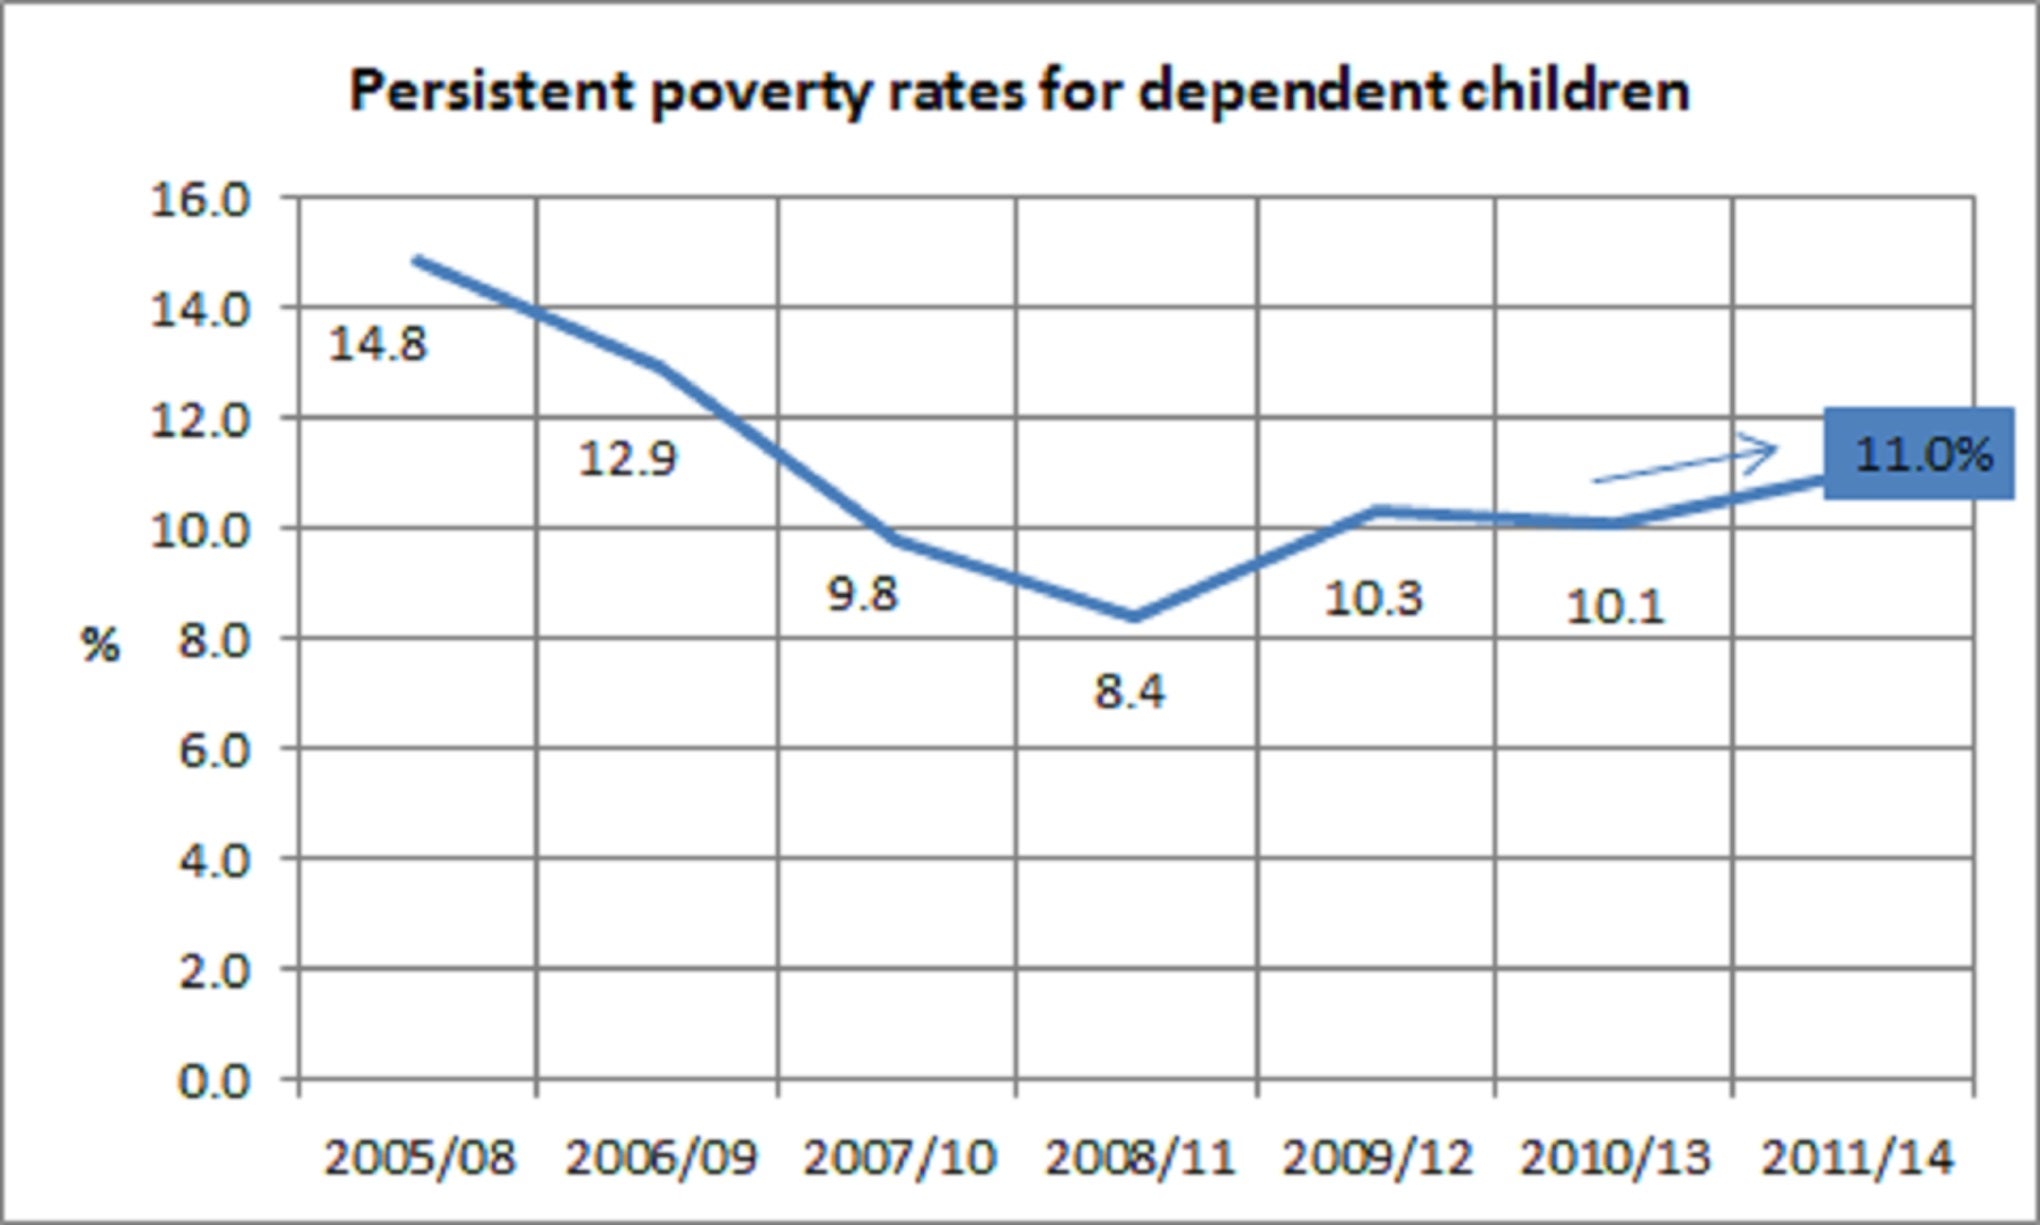
So while overall persistent poverty has fallen, the trend for persistent child poverty, like overall poverty, seems to be going the other way.
Join our commenting forum
Join thought-provoking conversations, follow other Independent readers and see their replies
Comments