Covid: How will Boris Johnson decide ‘roadmap’ out of lockdown?
Varying regional infection and hospital rates could see PM ease restrictions in some areas before others
Boris Johnson’s long-awaited “roadmap” out of lockdown is due to be announced on Monday.
The PM, along with a team of scientists, is said to be examining the latest Covid data over the weekend so he can clarify plans for easing England out of its third lockdown.
While no time or location has been given for the speech as yet, it is widely expected to go ahead on 22 February, so teachers can be given their two-week warning to return to classrooms on 8 March, as set out by ministers.
So, what data is likely to be considered over the weekend to make the call?
New cases
A total of 74,961 new cases were recorded in England in the seven days to 14 February – the equivalent of 133.2 per 100,000 people. This is the lowest seven-day rate since 4 October, when the figure stood at 124.8.
Follow Covid live: ‘Reckless’ for pupils to return to school at once
However, regional rates vary considerably. While the rates for London, eastern England and southeast England are the lowest they have been since the autumn, figures remain fairly high in areas like Corby in Northamptonshire (317.1), Middlesbrough (289.4) and Sandwell in the West Midlands (271.0).
The lowest are all in Devon: Torridge (14.6), West Devon (19.7) and South Hams (21.8).
Rates in other regions have dropped only to levels last seen in early to mid-December, though, pointing to the “staged” approach to ending lockdown, that Mr Johnson mentioned on Wednesday, meaning some areas are given freedoms ahead of others.
Infection rate
Infections have fallen substantially since Christmas – and even more moving from January into February – but the government will have to decide how much more the figures must drop before ministers can justify lessening restrictions.
Imperial College London’s latest React study showed the “prevalence of infection in the community” in England was 0.51 per cent, a drop of more than two-thirds since the last such report in January 2021 – when 1.57 per cent of people tested positive.
The interim findings also concluded the number of infections is halving every 14.6 days.
However, researchers warned occurrences of coronavirus were still high in England, with levels similar to those observed in September 2020.
The study, which has not yet been peer-reviewed, also found that while prevalence in total was lower across all nine English regions, declines were smaller in the northwest, northeast, and Yorkshire and the Humber.
London, the southeast and the West Midlands saw the greatest drops of infection in England, with occurrences of Covid falling by around 80 per cent in each.
Hospital admissions
The number of patients in England’s hospitals with coronavirus has fallen sharply in recent weeks.
A total of 15,633 patients were in hospital as of 8am on 18 February, according to the latest NHS England figures – down 54 per cent from a record 34,336 patients one month earlier.


Despite the significant drop, though, numbers at both a national and regional level are still higher than when England came out of its second lockdown on 2 December – and far greater than those seen in May 2020, when Mr Johnson announced the initial easing of Lockdown One.
As with case rates, there are differences regionally too. While the southeast and southwest of England have seen numbers decline to their lowest since mid-December, the Midlands and northwest have fallen only to where they were at Christmas. Again, it depends on how much leeway the government decides regions need to be let out of lockdown.
The number of daily hospital admissions of Covid patients stood at 1,311 on 16 February down 68 per cent from 12 January but above the 1,262 on the day England came out of its second lockdown on 2 December.
Vaccine rollout
The PM reported on 14 February that 15 million people across Britain had been offered their first dose of Covid vaccine, calling it “a significant milestone in the United Kingdom’s national vaccination programme”.
NHS England data suggests 13,817,914 people in England had received their first jab three days later – by 17 February.
This is the equivalent of 24.5 per cent of the total population of England – and 31.2 per cent of people aged 18 and over, based on the latest population estimates from the Office for National Statistics (ONS).
According to the ONS, by 14 February, an estimated 93.4 per cent of people aged 80 and over had received their first dose, along with 99.3 per cent of people aged 75-79 and 92.3 per cent of people aged 70-74.
There are wide variations between regions, though, with London lagging far behind in the eldest category.
Nearly one in five people aged 80 and over in the capital are yet to have their first Covid-19 jab, while 97.9 per cent in the same age group in the southwest of England have been given at least their first vaccine dose.
NHS England figures also show that 94.5 per cent of residents of older adult care homes in England eligible to have their first dose of Covid-19 vaccine had received the jab by 14 February, as well as 69.0 per cent of eligible staff in older adult care homes.
Care home residents and staff are classed as eligible for the vaccine if they have not had Covid-19 in the previous 28 days.
Around 88 per cent of patient-facing NHS Trust healthcare workers are likely to have had their first dose of vaccine by 14 February, NHS England added.
Deaths
Deaths are decreasing as a result of lockdown measures, and significantly so since the uptick in figures likely caused by the relaxing of rules for some regions around Christmas.
The current wave of coronavirus deaths peaked on 19 January, with a total of 1,280 deaths involving Covid-19 occurring in England on this date, according to the ONS.
Since then, the daily death toll for England has been on a slow and broadly downwards curve, dropping back below 1,000 on 29 January.
More recent figures, published by the government, show the daily death toll in England has fallen from a seven-day average of 903 on 1 February to 453 on 14 February.
ONS and government figures vary slightly due to the former involving any mention of Covid on a death certificate – the government’s only takes into account people who have died within 28 days of testing positive for the virus.
Separate figures from NHS England, based on the number of people who have died in hospital who have tested positive for Covid-19, show deaths of people aged 80 and over fell from 475 on the peak day of 19 January to 199 on 10 February 10 – a drop of 58 per cent.
This compares with a fall of 47 per cent among people aged 60 to 79 and 51 per cent for people aged 40 to 59.
While all measures of Covid-19 deaths show the numbers dropping, they still remain well above the levels recorded when England came out of its second lockdown on 2 December.
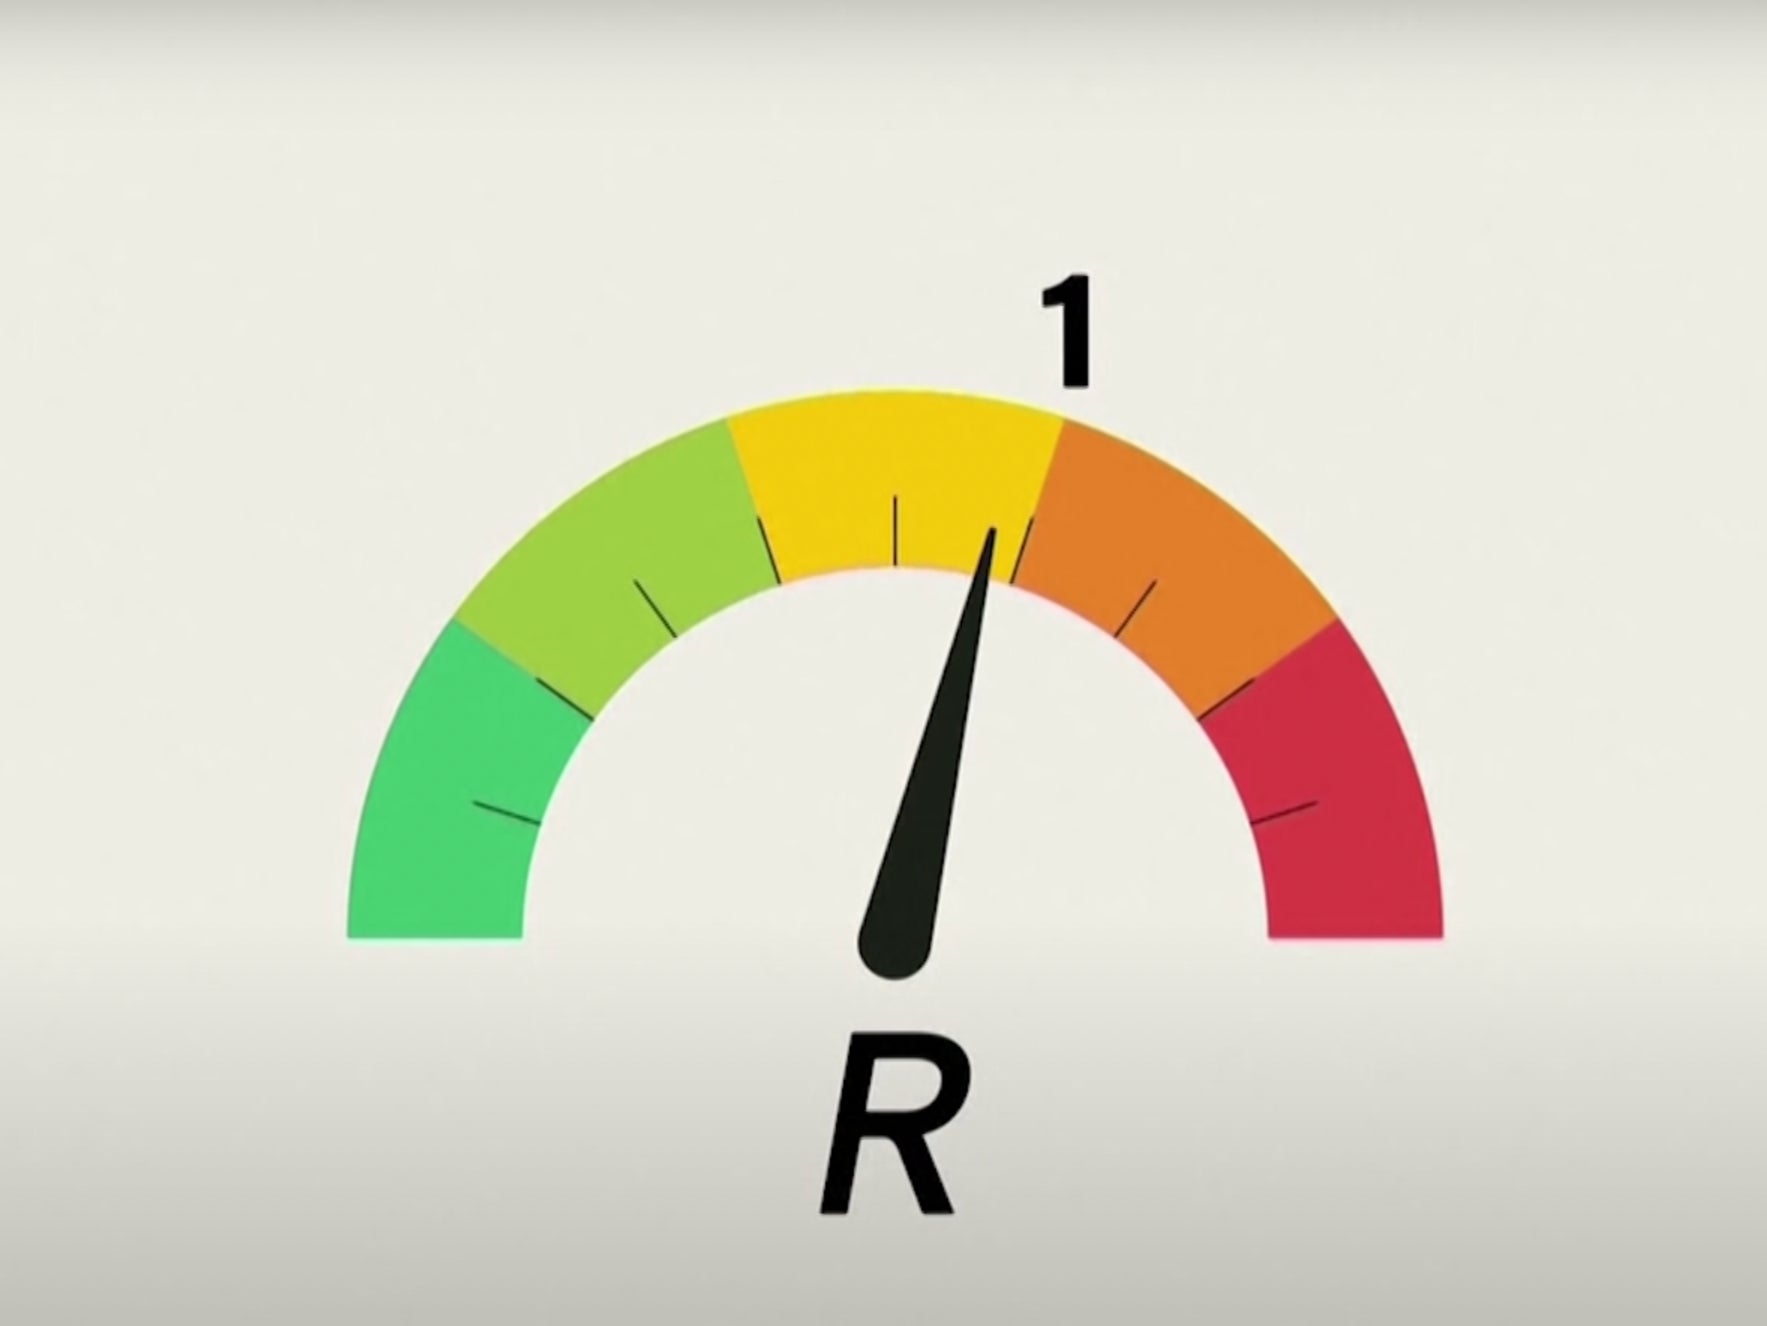
R number
The most recent React study, released on Thursday, calculated that England’s current reproduction number for coronavirus is 0.72.
Meanwhile, the Scientific Advisory Group for Emergencies (Sage) said on Friday it had the R number as between 0.7 and 0.9, meaning on average every 10 people infected will infect between seven and nine other people.
While Sage has published the same estimate the previous two weeks, it could prove significant as it is also the same as the very first recorded estimate for the R number in England – on 29 May 2020.
England’s R number has dropped since the beginning of 2021, when it was estimated as between 1.1 and 1.4, meaning on average every 10 people infected were infecting between 11 and 14 others.
Additional figures published on 19 February suggested the number of new infections is shrinking in England by between 3 per cent and 6 per cent every day. Plus, there is the React study’s estimate that infections are halving every 14.6 days.
While it remains to be seen how Mr Johnson will interpret this data, and what he will formally announce on Monday, one thing seems certain: the R number speedometer graphic that baffled the nation back in May is set to make a highly anticipated comeback.
Additional reporting by PA
Join our commenting forum
Join thought-provoking conversations, follow other Independent readers and see their replies
Comments
Bookmark popover
Removed from bookmarks