Dams: Deep trouble
Are vast dams around the world masking the full extent of sea-level rises? Steve Connor reveals why soon we may all be in...
Every schoolchild is told how the water cycle works. Most of us can even remember the diagram from geography lessons, showing water evaporating from the ocean, forming clouds in the sky and then falling back to the ground as rain, where it runs into streams and rivers and, finally, back into the sea.
The reality is more complicated, with scientists arguing over the finer points of balancing the "water budget" – how much water should stay on land, and how much should be left to flow into the sea. Now, suddenly, this debate has become of more than academic interest.
The reason for the sudden interest is a new study that attempts to calculate the effect of man-made dams and reservoirs on how much water returns to the oceans. The results are startling: so much water is now stored in dams that it's having a profound influence on the rate at which sea levels are rising.
Predictions for sea-level rises due to global warming affect hundreds of millions of people at risk from coastal flooding. The new research suggests that, over the past 50 years, new dams and reservoirs have held back some 10,800 cubic kilometres of water, which would have been enough to raise global sea levels by about 30mm. In other words, the rises we have seen so far due to global warming might have been considerably larger if it were not for the huge numbers of dams and reservoirs built from the 1950s onwards.
Ben Chao of the National Central University in Taiwan carried out the mammoth task of investigating the holding capacity of some 29,484 reservoirs in order to estimate how much water they have prevented from flowing into the sea. Most of these dams were built after 1950 when the number expanded rapidly, which accounts for the huge volume of water they have been responsible for collecting. Chao and his colleagues conclude that these dams and reservoirs have had a visible effect in slowing down the rate of global sea-level rise, which started in about 1960.
The study, published in the online journal ScienceXpress, is important because there is a huge debate taking place within the scientific community about how fast and how far sea levels will rise over the coming decades. Almost every country in the world has at least one major city built at sea level – from New York and London to Shanghai and Vladivostok – that could be threatened if sea levels continue to rise. It is estimated, for instance, that more than 100 million people in the world live within one metre of sea level. For them, every centimetre increase will make a real difference.
The Chao study seems to have explained one blip in the overall trend of rising sea levels – a slight fall in the rate of increase seen from about 1960. However, not everyone is convinced. "What the Chao study has done, it seems to me, is to do a good book-keeping job on the dams, so on face value it looks quite good," says Philip Woodworth of the Proudman Oceanographic Laboratory in Liverpool, a sea-level expert. "But it has ignored the ground water that has been pumped up to the surface. Nobody has a clue how much water has been pumped into the sea – although the volume is likely to be large. But at least they could have mentioned that."
At the same time that dams and reservoirs were being built, thousands of boreholes around the world were being drilled to bring up ground water that had been buried underground – in some cases for thousands of years. It is estimated that 1.5 billion people rely on ground water for domestic and industrial uses, and many major urban centres – such as Bangkok and Beijing – are heavily dependent on ground water being pumped from underground reservoirs. This, too, has to be taken into account when the amount of water flowing into the sea is being estimated: the bore holes will have increased the amount of water feeding back into the seas.
But other factors should also be taken into account. Many wetlands have been drained during the past 200 years, which means more water flowing into the oceans. Another influence is the depletion of natural lakes and rivers due to the extraction of water for human activities. Prime examples include the dramatic fall in the water levels of the Caspian and Aral Seas, and the huge Qinghai Lake in western China.
Deforestation is also believed to influence sea levels, although the relationship is complex. Forests effectively store water, and widespread deforestation can increase the amount of water running off the land into the sea. But deforestation can also cause a decrease in rainfall. However, scientists think that deforestation raises sea levels rather than lowers them.
But without a doubt the biggest influence on global sea levels is rising temperatures. A warmer world caused by an increase in man-made greenhouse gases not only melts ice, but also results in thermal expansion of the seas – warm water takes up more volume than cold. Dr Anny Cazenave of France's Laboratoire d'Etudes en Géophysique et Océanographie Spatiale (Legos) in Toulouse says that about 50 per cent of the sea-level rise observed over the past 15 years is attributable to thermal expansion. The rest is largely due to the melting of mountain glaciers and polar ice sheets.
Tide gauges were the main method of measuring sea levels until the first satellites began estimating the height of the sea in the early 1990s. Tide gauges are a relatively old technology, and the reliability of the data depends on how many are deployed – and there were fewer of them a century ago. However, there is a clear consensus among oceanographers that average sea levels around the world are rising.
The UN's Intergovernmental Panel on Climate Change (IPCC) says that it is "highly confident" that sea levels rose between the 19th and the 20th centuries, and that the total increase over the course of the last century is estimated to be 17cm. The IPCC also says that sea levels rose by an average rate of 1.8mm per year between 1961 and 2003. The rate was faster between 1993 and 2003, at about 3.1mm a year, the period when satellites began doing the job of measurement. It is not yet clear whether this acceleration is down to variability – in other words, a temporary increase – or if it was the result of a more disturbing, longer-term trend.
In predicting future sea levels, the IPCC is less sure. Its estimates for sea-level rise by 2100, for instance, range from 18cm to 59cm. But nearly everyone accepts that this is too optimistic, because of huge unknowns in balancing the water budget. One of the biggest uncertainties, for instance, is estimating how fast the ice sheets and glaciers of the Arctic and Antarctic will melt in a warmer world.
The IPCC has based its 2100 predictions on the belief that the polar ice sheets will melt in a gradual, linear way. However, there is growing evidence that, as ice sheets and glaciers melt, they begin to break up in a non-linear, dynamic fashion. In other words, things seem to be happening far more quickly than the computer models used by the IPCC have hitherto suggested. Dr Cazenave, who is a senior author for the IPCC on sea levels, says that future sea-level predictions are likely to revise the figures upwards.
Stefan Rahmstorf, Professor of Physics of the Oceans at Potsdam University in Germany, says that the IPCC's upper-band figure of 59cm is not the "worst case" scenario and that sea-level rises exceeding one metre by 2100 cannot be ruled out. But 2100 is, of course, not the end of sea-level rises. Even if we stabilise levels of carbon dioxide, temperatures will continue to rise due to the inertia of the climate system – heat will eventually penetrate the deep ocean. As a result, sea levels will continue to rise as a result of the continuing thermal expansion of the seas and the melting of the ice sheets. Today's rises are only the start of it.
Dam statistics
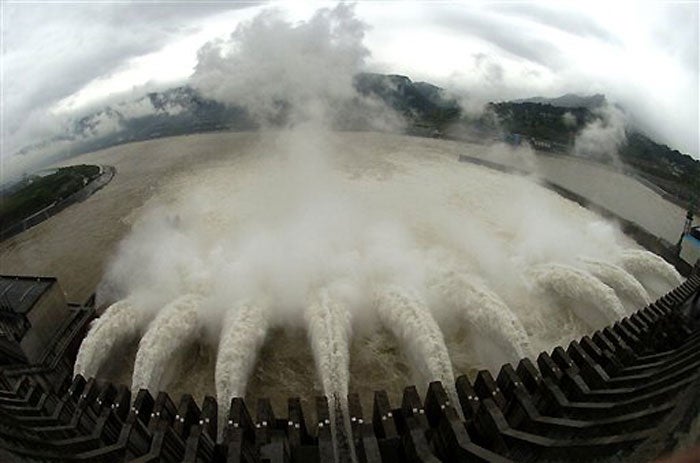
Three Gorges Dam, China
Volume: 39.3 million cubic metres. When fully operational in 2009, this will be the world's largest dam.
Chapeton Dam, Argentina
Volume: 296,200 cubic metres. This dam will be the world's second largest if completed, with a reservoir 30km long.
Tarbela Dam, Pakistan
Volume: 121,720 cubic metres. Built in 1968 to tame the Indus River's flooding during the monsoon season.
Fort Peck Dam, United States
Volume: 96,049 cubic metres. Finished in 1936, this is the grandaddy of dams.
Join our commenting forum
Join thought-provoking conversations, follow other Independent readers and see their replies
Comments
Bookmark popover
Removed from bookmarks