Same-sex couples are younger and better qualified, new stats reveal
The latest figures from the Office for National Statistics also show a continuing trend in people not marrying or entering civil partnerships

Same-sex married couples and those in civil partnerships are more likely to be younger, have no religion and have higher-level qualifications than their opposite-sex counterparts, the latest data shows.
Figures from the Office for National Statistics (ONS) also show a continuing trend in people not getting married, with the number of people doing so at the lowest rate on record.
Nearly four in 10 adults in England and Wales have never been married or been in a civil partnership, up from three in 10 at the start of the century.
The percentage has risen steadily over recent decades, from 26.3% in 1991 to 30.1% in 2001 and 34.6% in 2011, reaching 37.9% on the day of the latest census in March 2021.
The proportion of adults in a legally registered partnership has fallen over the same period, down from 58.4% in 1991 to 46.9% by 2021.
The latest data, published on Wednesday, also shows that the long-term increase in the proportion of adults who are divorced or have had a civil partnership dissolved has almost come to a halt – with similar figures for 2011 (9.0%) and 2021 (9.1%).

There has been a sharp rise in the proportion of young adults in England and Wales who have never been married or in a civil partnership – with more than half of women aged 30-34 in this category and 63.8% of men in the same age group.
The biggest increase is among females aged 25 to 29, up from 67.8% in the 2011 census to 80.5% a decade later.
While 18.3% of women aged 30-34 were unmarried or not civil partnered in 1991, that rose to 43.7% in 2011 and was at 54.2% in 2021.
For men, the biggest increase is among 30-34 year-olds, up 9.1 percentage points from 54.7% in 2011 to 63.8% at the time of the census.
Nearly nine in 10 (88.1%) males aged 25-29 are now unmarried or not civil partnered, up from eight in 10 (80.0%) in 2011 and just over half (54.2%) in 1991.
The ONS said census data showed that the average age for people in same-sex marriages is 44, compared with 55 for heterosexual married couples.
For same-sex civil partnerships the average age is 53.
The Marriage (Same-Sex Couples) Bill allowing same-sex couples to marry in England and Wales became law in 2013.
The average age of women in same-sex marriages is lower than for men – at 42 compared with 46 – and there is a larger proportion of men in same-sex civil partnerships and a larger proportion of women in same-sex marriages, the ONS added.
Same-sex married and civil-partnered couples have higher proportions of degree or equivalent qualifications than opposite-sex married people, the ONS said, while those in same-sex civil partnerships are more qualified than those in same-sex marriages.
When it comes to ethnicity and after taking age into account, the ONS said people from black, black British, black Welsh, Caribbean or African, and “mixed and multiple” backgrounds had the highest proportions of adults who have never been married or civil partnered, while Asian, Asian British or Asian Welsh had the lowest.
Steve Smallwood, demography topic lead at the ONS, said: “The census gives us a fascinating picture of how society is changing and today’s analysis shows us, for example, that adults in same-sex marriages and civil partnerships are more likely to be younger, have no religion and have higher-level qualifications than adults in opposite-sex marriages.
“When we account for age distribution, we can also see the proportions of adults overall who have never been married or civil partnered was highest among adults reporting ‘no religion’ and within the black and mixed ethnic groups.”
The statistics show that almost a fifth (19.4%) of women aged 55-59 are divorced or were in a civil partnership that is now dissolved, the highest level for any age group and up from around one in 12 (8.3%) in 1991.
The highest figure for men is in the 60-64 age group, at 15.5%, up from 5.7% in 1991.
The proportion of adults who are divorced or who used to be civil partnered increased between 2011 and 2021 for all women aged 55 and over, while for men it has risen in all groups aged 60 and over.
The drop in the proportion of younger adults who are divorced is expected to be partly a result of the increase in the average age at marriage, the ONS said.
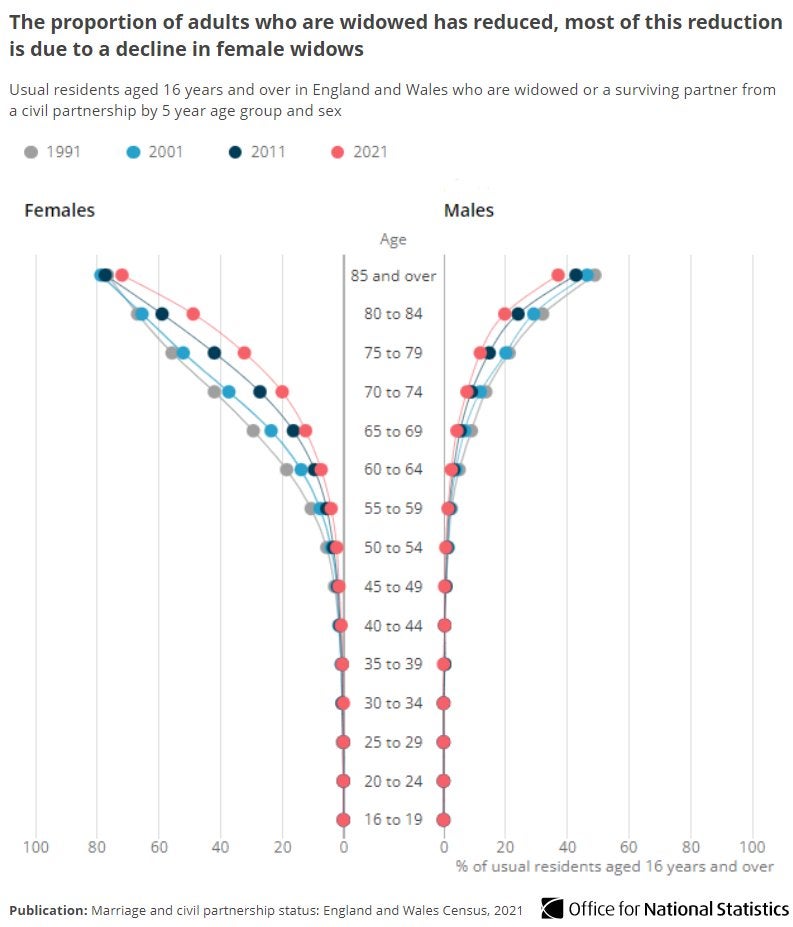
Meanwhile, the proportion of adults who are widowed has declined steadily across the decades from 9.1% in 1991 to 6.1% in 2021.
Between 2011 and 2021 women who are widowed decreased by 8.3%, but the number of men who are widowed increased by 0.6%.
The ONS said the number of female widows has fallen as the gap in life expectancy between men and women has reduced.


Bookmark popover
Removed from bookmarks