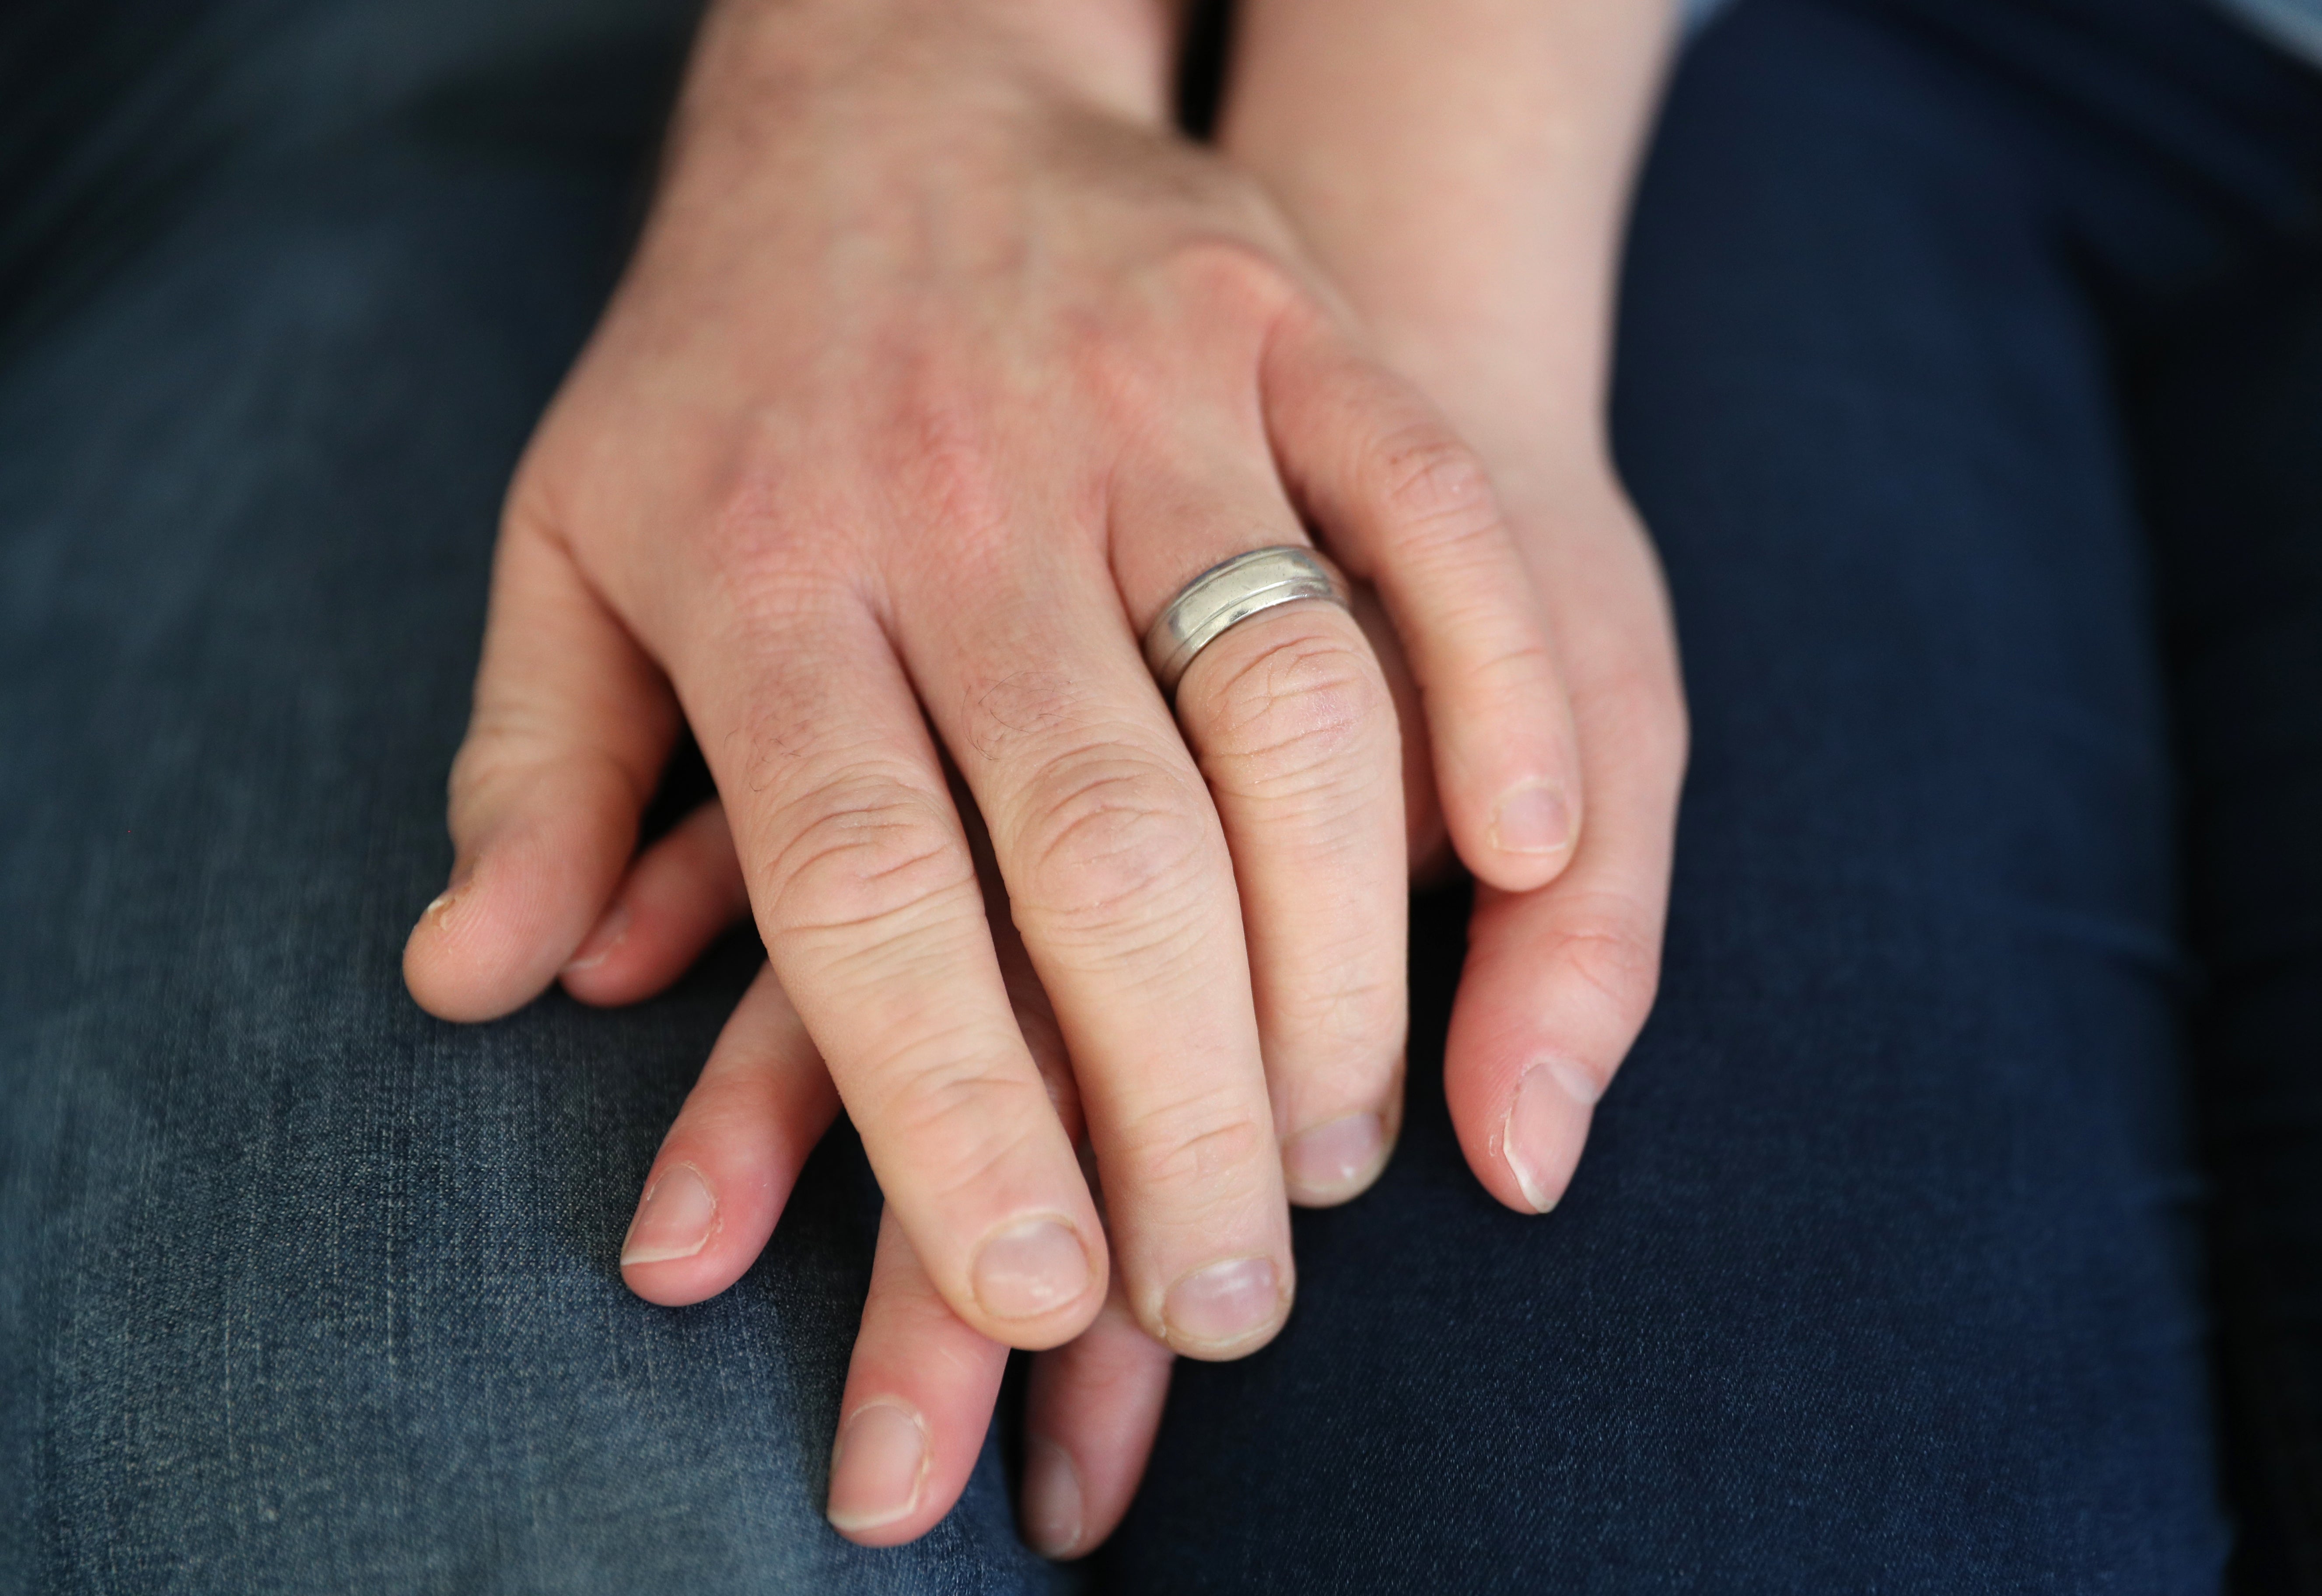
Marriage rates for opposite-sex couples drop to new record low
The age of heterosexual couples tying the knot has continued to climb.

Marriage rates for opposite-sex couples in England and Wales fell to a new record low before the Covid-19 pandemic, figures show.
There were 18.6 marriages per 1,000 unmarried men in 2019, along with 17.2 per 1,000 unmarried women – the lowest figures since records began in 1862.
Rates have been on a downward trend since the early 1970s, reflecting a long-term shift in behaviour by couples towards cohabiting or delaying marriage until they are older.
A total of 213,122 heterosexual couples tied the knot in 2019 – down 50% from the peak in 1972 and the lowest number since 1888.
The figures, which have been published by the Office for National Statistics (ONS), also show that religious ceremonies accounted for less than one in five (18.7%) of opposite-sex marriages in 2019, again the lowest percentage on record.
Rates for men and women in England and Wales entering into same-sex marriages were unchanged, with 0.5 marriages per 1,000 unmarried men and 0.6 per 1,000 unmarried women.
The number of same-sex marriages was 6,728, down slightly year-on-year from 6,925 in 2018.
Dr James Tucker, head of ONS health and life events analysis, said: “Today’s data show a decline in marriage rates for opposite-sex couples while rates for same-sex couples have remained the same.
“This decline is a likely consequence of increasing numbers of men and women delaying marriage, or couples choosing to live together rather than marry, either as a precursor to marriage or as an alternative.
“Future analysis will show the impact of the pandemic on marriages rates.”
The median average age of men and women tying the knot in an opposite-sex marriage reached a record high in 2019, at 34.3 years for men and 32.3 years for women.
This is up from 31.6 and 29.4 years respectively in 1999, and 23.7 and 21.8 half a century ago in 1969.
The most popular day to get married in 2019 was a Saturday, with August being the most popular month for both opposite-sex and same-sex marriages.
Saturday July 27 was the most popular date of all, with 3,628 marriages taking place.
Over the last two decades, the most popular day to get married was September 1, followed by August 25 and July 28, the ONS found.
Valentine’s Day ranked 49th in popularity, while Christmas Day was in last place.
There has been a long-term fall in the proportion of marriages that are religious ceremonies.
In 1967 they accounted for two-thirds (66%) of all marriages in England and Wales, but by the mid-1970s this had dropped to around a half, remaining roughly level with the proportion of civil ceremonies for almost 20 years.
Since 1992 the percentage of civil ceremonies has increasingly outnumbered its religious equivalent, accounting for 82% of all marriages in 2019.
Bookmark popover
Removed from bookmarks