Labour wants you to trust them with the economy again: 7 charts that show how they coped last time they were in power
Labour has put its economic record at the heart of its manifesto launch: but what is it?
Ed Miliband has put Labour's economic competence at the heart of his party's manifesto launch, pledging not to borrow extra money.
The Conservatives say Labour is to blame for running up the country’s debts.
How did Labour do last time it was in power?
Here are seven key economic indicators from Labour's last time in government and what happened to them.
Most people got richer until the crash
Incomes for the median household increased quite strongly under Labour. Most people saw a steady increase in prosperity until 2004.
After 2004 income growth started to stutter; the median figure is used instead of the mean because it helps exclude distortions caused by rocketing incomes at the top.
Unemployment fell then went up again sharply
Labour brought unemployment down from the high days of the last majority Conservative government for most of its time in government.
Unemployment increased dramatically after the crash but never hit quite the same highs as the Thatcher years. Likewise, Labour's 'economic peacetime' employment rate was never as low as the rate during the post-war consensus.
Labour introduced the minimum wage and increased it until the crisis
Labour introduced the minimum wage in 1999 at a relatively low rate and increased it rapidly in real terms until 2006. It then began to decline under the global financial crisis.
Increases in the minimum wage are recommended by the independent Low Pay Commission but the Government is ultimately responsible for the rate.
Spending only really rose after the crisis
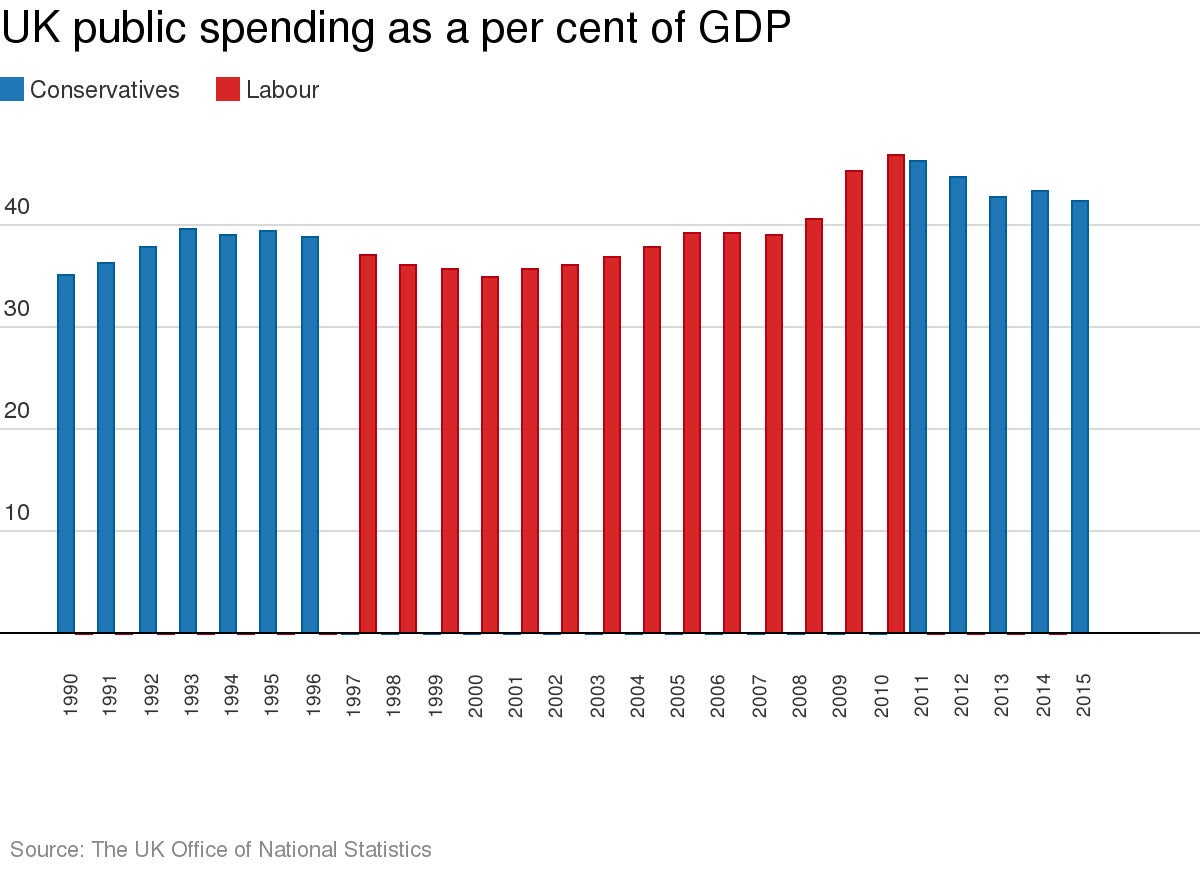
In 1997 Labour pledged to stick to Tory spending plans. In government the party followed through on this promise and steadily reduced public spending as a percentage of GDP until 2001.
Liberated from these constraints after the next election Labour gradually increased public spending back to levels just below those of the last Conservative government. When the economic crisis hit in 2008 automatic stabilisers kicked in and public spending jumped higher.
Debt was actually historically low for the whole government
Increased public spending in the second half of the Labour government had very little impact on the total stock of debt the government had compared to historic levels.
When the financial crisis hit the increase in debt was sharp but the overall level still low compared to historic levels. Debt has continued to increase at a similarly steep rate under the coalition but still remains low by historic standards.
Houses became increasingly unaffordable as their owners got rich
House prices rose quickly and at a steady rate under Labour until 2008. A fall occurred during the property crash of 2008 but this loss has since been recovered.
The richest 1% kept getting richer
Between 1997 and 2008 Labour continued the trend of governments allowing more and more money to flow to the richest 1% of the population. The global financial crash saw a temporary fall in this income, which has since resumed growing.
Join our commenting forum
Join thought-provoking conversations, follow other Independent readers and see their replies
Comments