State of Union address 2016: fact-checking Obama's boldest statements
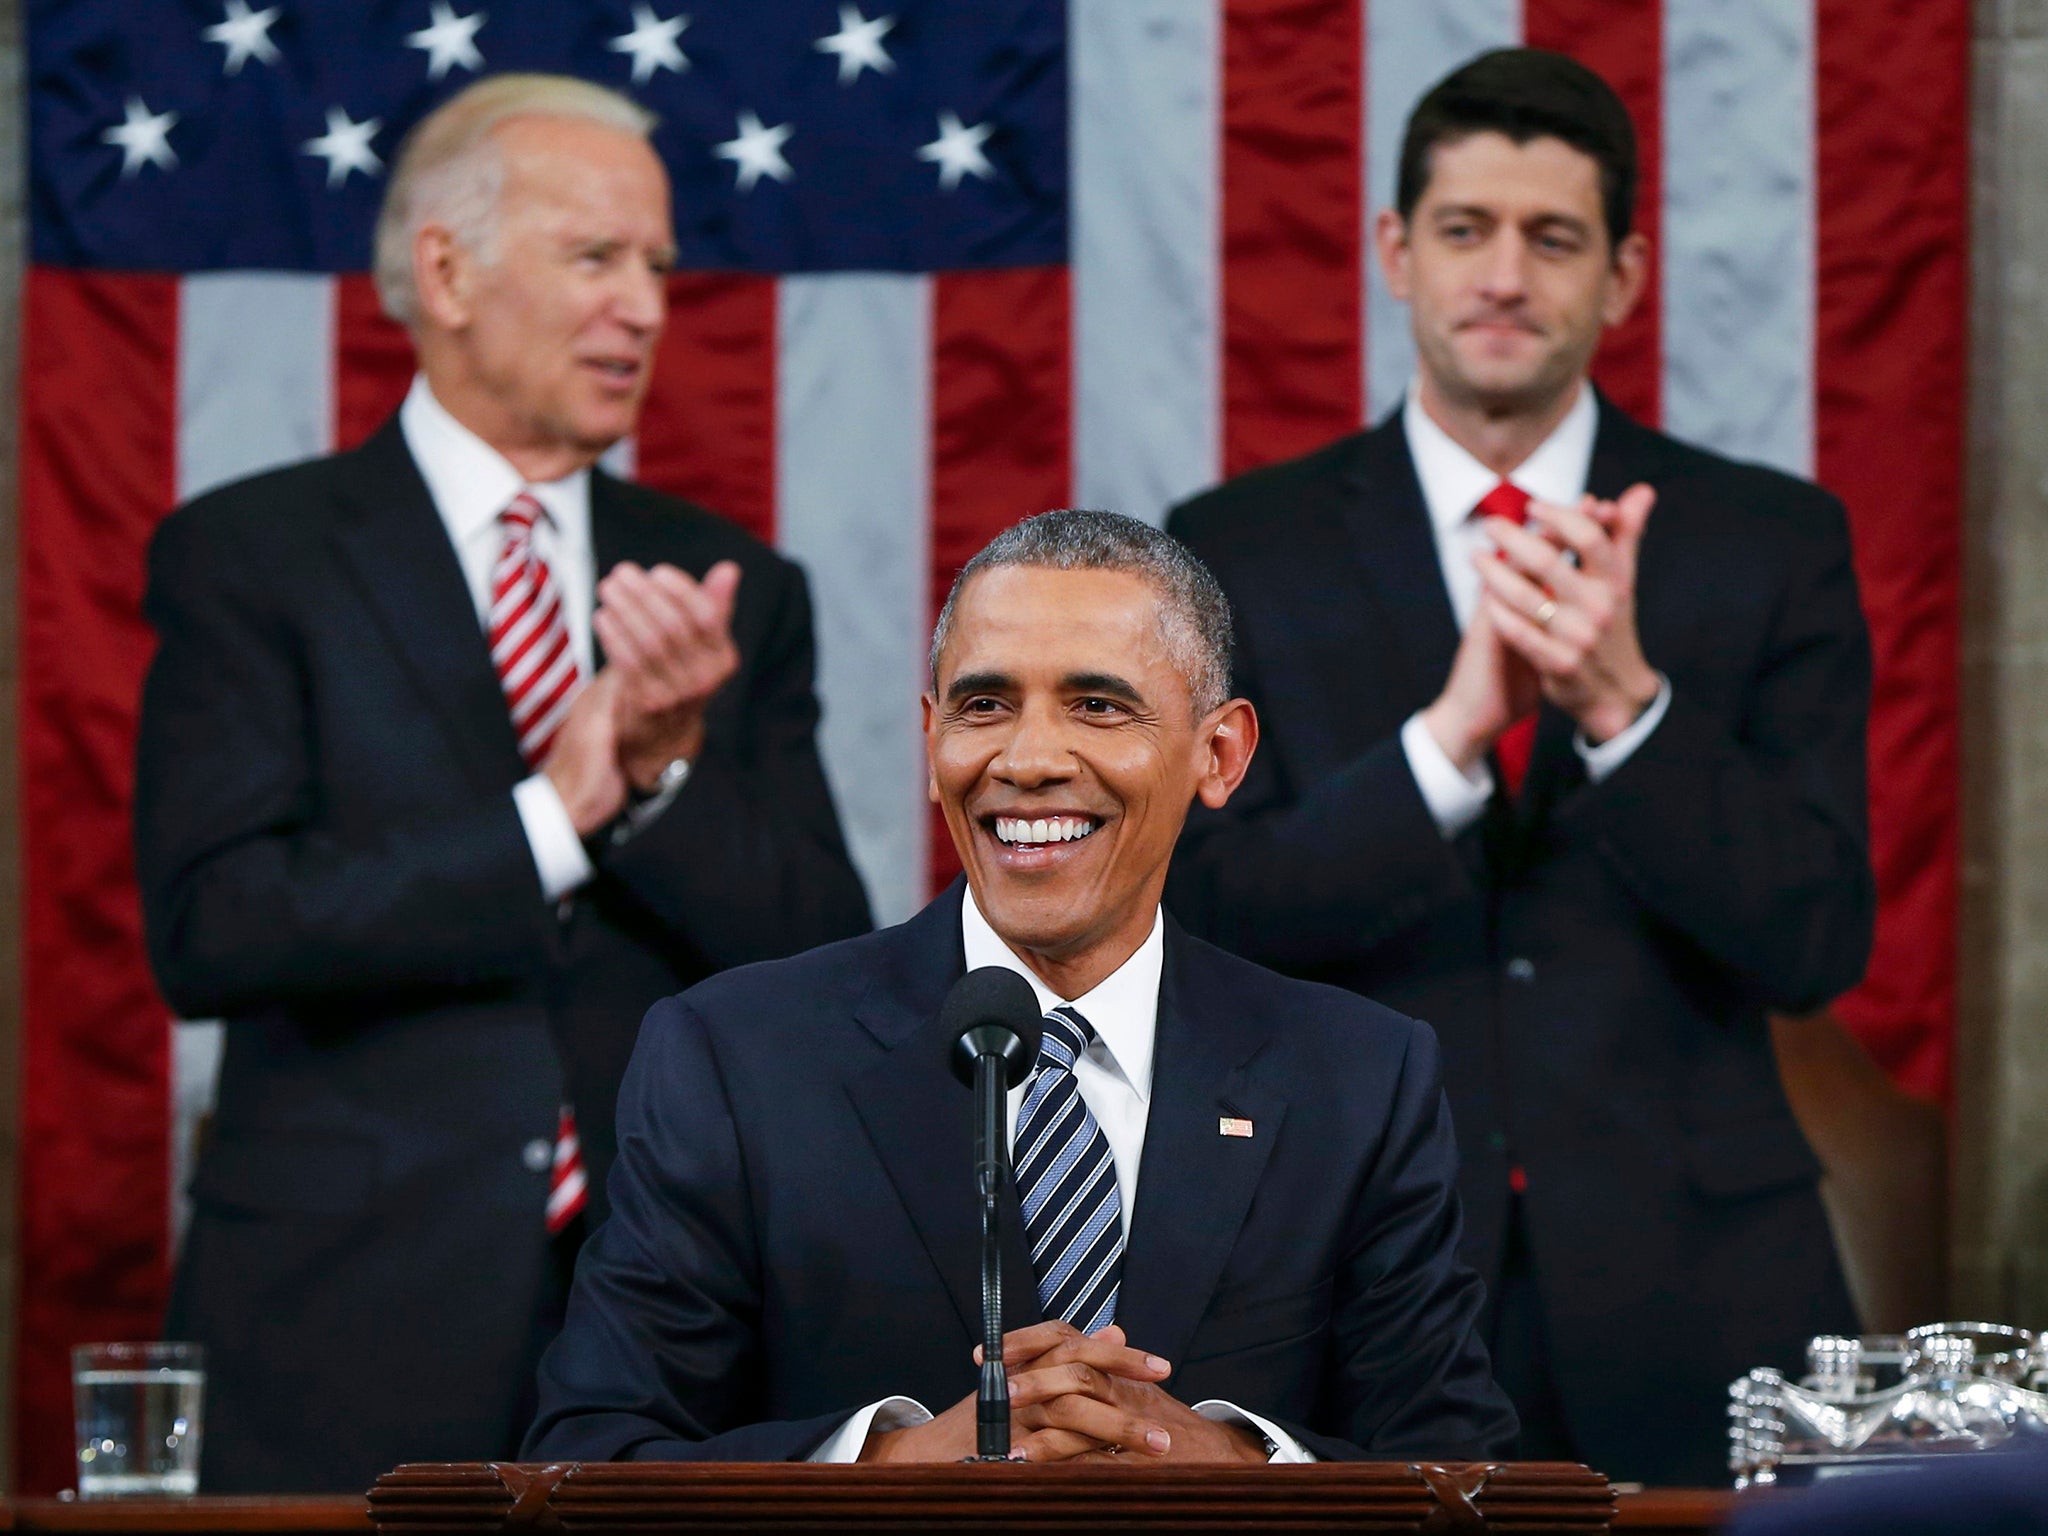
President Obama looked back on his time as president and took shots at republican presidential candidates
A State of the Union address is often difficult to fact-check, no matter who is president. The speech is a product of many hands and is carefully vetted, so major errors of fact are relatively rare. But State of the Union addresses often are very political speeches, an argument for the president’s policies, so context is sometimes missing.
Here is a guide through some of President Obama’s most interesting claims, in the order in which he made them. We also checked one claim in the GOP response. As is our practice with live events, we do not award Pinocchio rankings, which are reserved for complete columns.
“We’re in the middle of the longest streak of private-sector job creation in history. More than 14 million new jobs; the strongest two years of job growth since the ’90s; an unemployment rate cut in half.”
While President Obama often has touted what he often calls the “longest streak of private-sector job creation in history,” the average number of jobs created in this 70-month period is significantly lower than under either Bill Clinton or Ronald Reagan. (When you exclude a single month of decline, in fact, Clinton and Reagan had streaks of 85 and 71 months, respectively.)
The low point in jobs was reached in February 2010, and there has indeed been a gain of 13.6 million nonfarm jobs since then, according to Bureau of Labor Statistics data. But it’s worth remembering that in the same period, the number of federal, state and local government jobs has actually declined by nearly 500,000.
The unemployment rate was 7.8 percent when Obama took office in 2009, and now it is 5 percent. The president says it was cut in half by measuring from the high point reached during his presidency: 10 percent in October 2009.
Still, even with the massive jobs losses at the start of his presidency, Obama can claim that nearly 9.3 million jobs were added since he took office. At this point in George W. Bush’s presidency, the comparable number was 1.3 million; and for Bill Clinton and Ronald Reagan, the figure was 21.2 million and 12.7 million, respectively.
“Manufacturing has created nearly 900,000 new jobs in the past six years.”
The low point for manufacturing jobs was reached in February 2010, and there has been a gain of 878,000 jobs since then. But Bureau of Labor Statistics data show that the number of manufacturing jobs is still 230,000 fewer than when Obama took office in the depths of the recession — and 1.4 million fewer than when the recession began in December 2007. Indeed, the United States only gained 30,000 manufacturing jobs in all of 2015.
Here’s a graph that shows the trend over the last ten years:
“And we’ve done all this while cutting our deficits by almost three-quarters.”
The improvement in the economy, coupled with the spending cuts in the sequester, has yielded a significantly lower deficit than just a few years ago. The deficit for the fiscal year that ended Sept. 30 was $439 billion.
For economists, raw numbers mean less than the percentage of the gross domestic product, and here, too, there has been an improvement. As a percentage of the GDP, the deficit in fiscal year 2015 was 2.5 percent, the lowest level since 2007.
For fiscal year 2009, when Obama took office, the deficit was 9.8 percent of GDP, so that’s a 75-percent reduction.
“We spend more on our military than the next eight nations combined.”
The president used to say “roughly ten nations” when making this comparison, but cuts in U.S. defense spending and increases in estimates of Chinese spending appears to have shifted the calculation.
The mostly widely cited public source for this claim is the Stockholm International Peace Research Institute, which tallies public numbers each year. SIPRI urges caution in how its data is used, saying that “attempts to draw conclusions about a country’s level of military capability from its level of military expenditure should be regarded with considerable skepticism.”
That’s because raw numbers can be misleading. The official Chinese figures are believed to be understated—and it costs China less money to buy the same goods and services as the United States. A rough calculation of purchasing power parity suggests the correct figure for Chinese defense spending could be double official estimates.
The comparison to China also does not include the fact that because it is not a global power, Beijing may actually spend more on its military in the western Pacific than does the United States.
Moreover, the United States ranks ninth when military spending is measured as a percentage of the gross domestic product, according to the CIA Factbook. Percentage of GDP is a good indicator of how a country chooses to use its resources — the top ranks of the list are dominated by oil-rich Middle Eastern countries and Israel — but the statistic does not shed much light on the effectiveness of a country’s military. So there are also limitations in that comparison.
“Gas under two bucks a gallon ain’t bad, either.”
In lauding his achievements in energy, the president made a reference to the dramatic decline in gasoline prices. But the White House graphics that accompanied his speech in its posting on Medium included a sentence that made a claim based on much higher gas prices.
The graphic claimed that “Americans will save nearly $8,000 at the pump in 2025 thanks to doubling the fuel efficiency of our cars and light trucks.” But there are two big caveats to that figure, which comes from official government estimates of the savings over the lifetime of a car between 2012 and 2025.
First, gasoline was presumed to cost about $3.42 before taxes, so obviously any savings from fuel efficiency would be significantly reduced if gasoline stays at current $2-a-gallon levels. Second, the cost of the rules was estimated to amount to $3,000, thus reducing the savings to car owners to $5,000 even before the impact of lower fuel prices is considered.
“On rooftops from Arizona to New York, solar is saving Americans tens of millions of dollars a year on their energy bills, and employs more Americans than coal — in jobs that pay better than average.”
According to the Solar Foundation, an independent energy research non-profit, the median wage for solar designers is about $27 per hour, and solar installers earn a median wage of $21 per hour. (Solar installers’ hourly median wage was $19.24, according to the Bureau of Labor Statistics’ most recent, May 2014 figures.) Workers in solar assembly earn $18 per hour. These figures are, indeed, higher than the median hourly wage for all occupations as of the most recent figures in May 2014, at $17.09. (However, the median hourly wage for employees in the mining industry – including coal mining – is also higher than the median hourly wage for all jobs — at $48.54. )
The group reported in its 2015 Census that the solar workforce is larger than the coal industry and other fossil fuel generation sectors. It used Bureau of Labor Statistics figures to compare coal industry employees to solar industry employees, as measured through its survey of more than 7,600 U.S. businesses.
As of October 2015, the coal mining industry had 65,000 jobs. Per the Solar Foundation’s 2015 figures, there were 119,931 people employed in solar installation.
Obama’s statement comes from the Department of Energy’s Website, which cites the Solar Foundation’s wage figures. But the source is unclear for the claim that solar is saving “tens of millions of dollars a year” on energy bills for Arizona and New York residents. Solar power is, indeed, growing rapidly in New York and Arizona. While the Department of Energy appears to attribute the savings figures to the Solar Foundation, the claim that solar customers are saving $13 million in Arizona and $11 million in New York every year is not in the non-profit’s most recent annual report.
It’s worth noting that in Arizona, there is an ongoing controversy over whether residents truly are getting lower rates on solar energy. Energy regulators in the state are battling with utility companies over net metering, which is the process through which solar customers get a credit for a certain amount of electricity that they send back to the grid. Regulators are working on a compromise deal that could result in a cost-shift for non-solar customers.
“Here are the results. In fields from Iowa to Texas, wind power is now cheaper than dirtier, conventional power.”
Texas and Iowa lead the nation in wind power, and the cost of wind power surely is lower in those states than in others. But this claim overlooks the impact of the federal tax credit that has driven much of the cost of wind power down.
The average price of coal and natural gas power ($65 per megawatt-hour) is still cheaper than newer sources of energy like wind ($80) and solar ($107), according to the Dallas Morning News.
In particular, the Production Tax Credit is a crucial subsidy that allows wind energy to compete with energy from fossil fuels. This tax credit is the driving force behind negative wind power pricing in Texas, according to a 2015 report by the Institute of Political Economy at Utah State University and public policy research organization Strata. Texas also provides many state-level financial incentives for wind power generation.
The Department of Energy estimates that within a decade, wind power will become cost-competitive with fossil fuels without a federal tax incentive. The White House noted that solar and wind energy prices are now becoming competitive with energy from conventional fuel sources.
GOP Response
“Many of your frustrations are my frustrations. A frustration with a government that has grown day after day, year after year, yet doesn’t serve us any better.”
–South Carolina Gov. Nikki Haley
Actually, federal government employment has dropped during the Obama administration; at one point in 2014 federal employment reached the lowest level since 1966. There has been a slight uptick since then, but even so as a percentage of total employment, the federal government now has the smallest share since World War II.
Here’s a graph that shows total federal employment since 1939. The spikes every ten years reflects temporary hiring for the U.S. Census.
Washington Post
Join our commenting forum
Join thought-provoking conversations, follow other Independent readers and see their replies
Comments
Bookmark popover
Removed from bookmarks