George Osborne has failed in his deficit reduction ambitions - and the Tories are likely to pay a price at the ballot box
The plan was to start paying off the national debt by the end of this Parliament

Dealing with the public finances was one of the main claims to fame the Tories made before the May 2010 election. Trust us, they said, we will impose our austerity and cut the structural deficit faster than Lewis Hamilton can drive his Formula One car round a race track. We are the capable ones, they said, compared with that profligate Labour lot who were responsible for the collapse of the subprime housing market in Detroit, California, Ireland and Latvia. It was Labour that caused the global financial crisis by its welfare spending, was the inference. We are the “fixers” of the public finances, was their claim.
The plan, according to the Chancellor, was to start paying off the national debt by the end of this parliament. Indeed, in his emergency Budget statement delivered to the House of Commons on 22 June 2010, George Osborne went as far as to claim: “The formal mandate we set is that the structural current deficit should be in balance in the final year of the five-year forecast period, which is 2015-16 in this Budget”. Don’t fall about laughing, dear reader.
The plan derailed. The ONS showed last week that borrowing totalled £11.4bn over the month, higher than the £10.7bn forecast by economists, and £3.8bn more than in June 2013. Excluding the impact of a one-off cash transfer from the Bank of England in June last year, borrowing in the first three months of the 2014-15 fiscal year was £36.1bn, 7.3 per cent higher than the same period last year. Chris Leslie, shadow Chief Secretary to the Treasury, said: “George Osborne is not only set to break his promise to balance the books by next year, he is also borrowing more so far this year than the same period last year. Borrowing is now expected to be almost £190bn more than planned under this Government. This is the cost of three damaging years of flat lining and falling living standards we have seen since the election.” Certainly looks that way.
In June 2010 the Office for Budget Responsibility forecast the structural current deficit would be eliminated by 2014-15 and be even more strongly in surplus in 2015-16. They forecast that public net debt as a percentage of GDP for the following four years would be as follows: 2011/12 67.2 (71.2 per cent ); 2012/13 69.8 per cent (74.2 per cent); 2013/14 70.3 per cent (76.3 per cent); 2014/15 69.4 (q22014=77.3 per cent). The actual figures are in brackets. Robbie Burns was right, the best-laid plans of mice and men often do go awry.
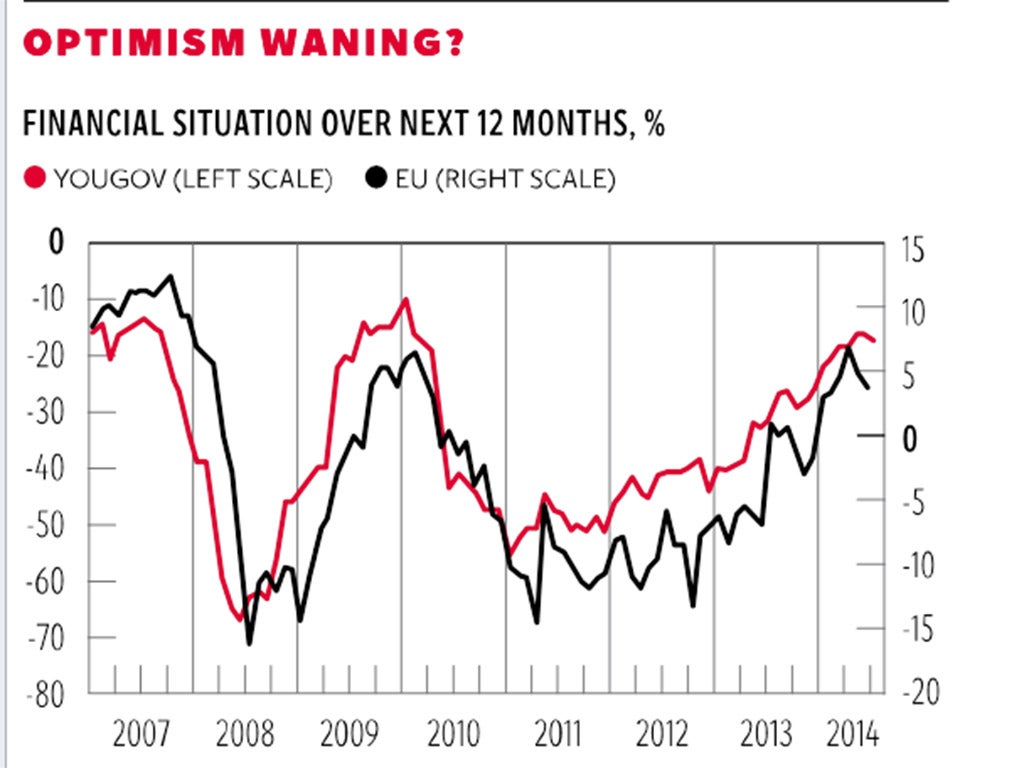
The first chart (above) makes clear how much households have struggled financially under the Coalition; hence the problems for the public finances. It plots answers to the question: “How do you think the financial situation of your household will change over the next 12 months?” Two lines are plotted, the first from YouGov, which plots the difference between the proportion saying “better” and those saying “worse”. So in the latest poll taken between 17-18 July 2014 16 per cent of respondents said better and 36 per cent said worse, so minus 20 per cent would be plotted. To smooth the data I simply take monthly averages. The second line plots a balance using the same question from a monthly survey of consumers conducted by the European Commission. Here respondents are given a choice of “get a lot better” (BB); “get a little better” (B); “stay the same”; “get a little worse” (W); “get a lot worse” (WW) and “don’t know”. The balance is just BB+B/2-WW-W/2. The higher the number the better respondents think their finances will be.
Several facts stand out. First, the two series tell a very similar story. Second, expectations collapsed in 2007 and, largely un-noticed, were at historically low levels by the spring of 2008; they then recovered sharply through 2009 and early 2010 as fiscal and monetary stimulus took hold. As soon as the Coalition took office, according to both measures, animal spirits collapsed again. In my view this was in large part down to loose – and totally incorrect – talk, as I discussed in last week’s column, by Mr Osborne in particular but also David Cameron and Nick Clegg of austerity and the UK being close to bankruptcy and identical to countries that don’t have their own central bank and currency that they can borrow in. Second, expectations of what will happen to households’ financial situation picked up in 2014 but are still below the levels the Coalition inherited. Worryingly, recently, both measures have ticked back down again.
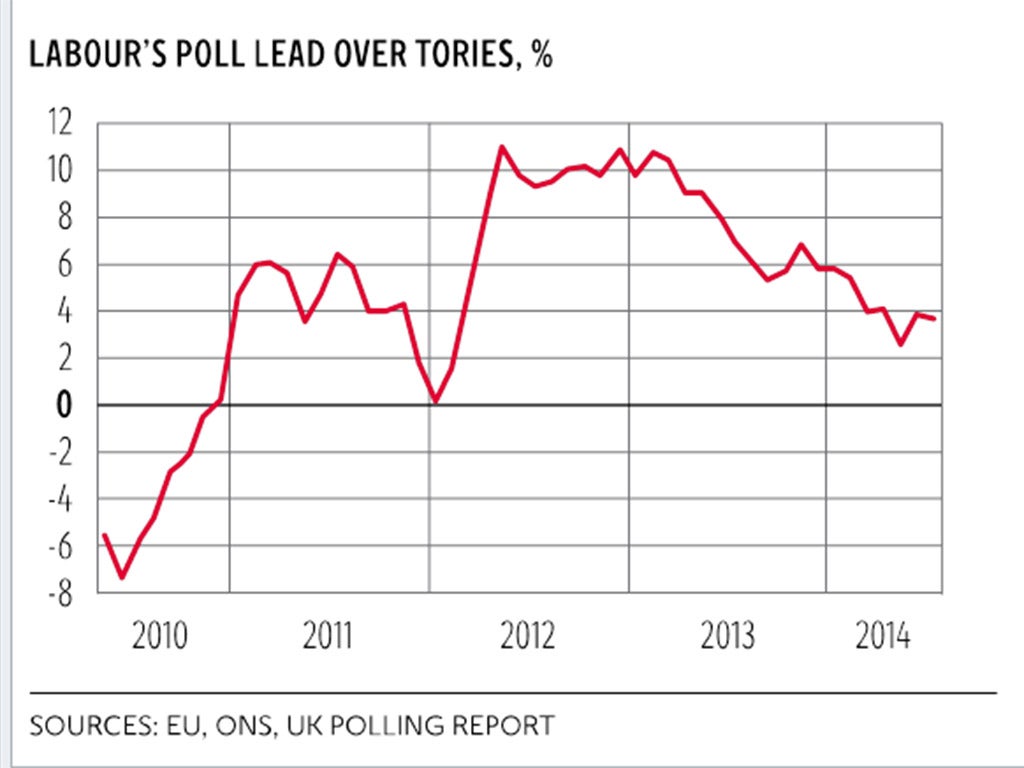
The second chart takes data from the 1,575 polls undertaken since the May 2010 election, and plots the monthly averages of Labour’s lead over the Tories. The idea behind taking monthly averages is to simply smooth out some of the daily volatility.
Several facts also stand out. First, Labour’s lead was highest between June 2012 and May 2013 at almost exactly 10 percentage points with the economy in the doldrums. Since then the lead has fallen, as households’ expectations of their financial situation improved, Third, it does appear that the Labour lead has stabilised this year, despite the continued improvement in the economy, and averages out at 4.2 percentage points since the start of 2014 and 3.8 percentage points in July, which are not significantly different from each other. The big question now is whether the downward trend in Labour’s lead over the last year or so will continue.
The problem for anyone wanting to forecast the outcome of the next election is that there may be no relevant precedents. We haven’t had a coalition in the post-war period and we have had an unprecedented collapse in living standards. Prior relationships may not hold. It is generally assumed that poll leads narrow as the election date approaches but as has been shown by Rob Ford, Will Jennings, Mark Pickup and Christopher Wlezien, the academics running the Polling Observatory project, that isn’t always the case.
On average, they find, over the 14 general elections since 1955 the average swing from opposition to government over the last 12 months is 2.7 percentage points. But on four occasions (1959, 1979, 1983 and 1992) the swing was in the opposite direction, away from the government.
In 1997, rising economic optimism did nothing for the Conservatives because people gave them no credit. The authors conclude: “So while an improvement in the Conservatives’ relative position is historically likely, it is not certain, and it is unlikely to be a dramatic shift.” What happens to living standards is going to be crucial.
Join our commenting forum
Join thought-provoking conversations, follow other Independent readers and see their replies
Comments
Bookmark popover
Removed from bookmarks