Hamish McRae: Why shares thrive while the economy flounders
Economic View: Apply the buy/sell rule to equities over the past 40 years and you would have spent 2000 to 2008 outside the market

For free real time breaking news alerts sent straight to your inbox sign up to our breaking news emails
Sign up to our free breaking news emails
If the economy is so weak, why are share prices so strong? The short answer is that the money the central banks are spraying around has to go somewhere, but that is neither a complete nor a satisfactory one. It must be true that liquidity is driving everything at the moment, but there have been sharp reactions in some markets, notably commodities, energy and gold. And the tidal wave of money has yet to float off some countries' property markets, including bits of our own one.
There has been no shortage of bad news around, including some weak data from the US and Germany, yet both equities and bonds have sustained their solid performance this year. For equities, the S&P 500 index is up 11.4 per cent this year and 17.7 per cent on 12 months earlier; the FT 100 is up 10.7 per cent and 17.8 per cent; the German DAX is only up 1.7 per cent this year but 17.4 per cent on a year earlier; and the French CAC 5.5 ahead this year and, perhaps surprisingly, 26.2 per cent over the past year. France's President Hollande may say he hates the rich but under his stewardship they have got a lot richer.
Prime-bond yields have remained remarkably low, though for the US and UK they are not back down to the levels of last summer when the flight to safe havens was at its height. Thus 10-year government bond yields are now 1.7 per cent for the US and UK, 1.25 per cent for Germany, and 1.75 per cent for France. That is its lowest ever. Indeed, this revival of confidence in France's ability to handle its debt is remarkable, for a year ago France was paying 3 per cent for 10-year debt. So much for the loss of the AAA status; the markets evidently don't give a toss what the rating agencies think.
So what happens next? Three or four months ago the talk was all of the "great rotation". Bond yields would rise as people switched to equities. It hasn't happened. Equities have done well, but so too have bonds. So the first issue is how solid are both of these rises.
Equities first: I have been looking at a couple of rather different commentaries on global equities, one from a giant, Goldman Sachs, the other from a boutique, Longview Economics. The Goldman view is that you should be overweight equities and underweight bonds. In other words, the rotation will indeed occur. The case for equities is that while the past month or so has seen some negative reaction, some of the risks are now accepted and these will therefore tend to diminish in the months ahead. Goldman thinks that one should remain overweight in equities for the next year. Valuations in the US are a bit higher than they have been in the long term, but rather lower outside the US.
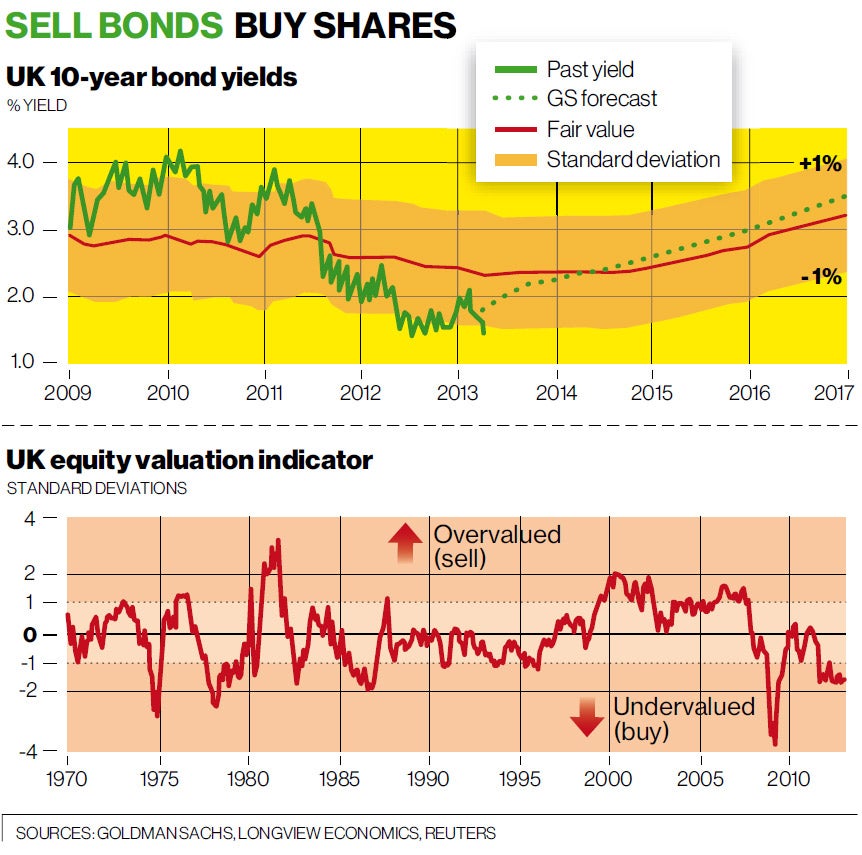
By contrast it thinks bonds are overvalued. You can see in the top graph what has happened to UK 10-year gilts, together with a calculation of what a fair value should be, with one standard deviation on either side of that band. Looking forward, Goldman projects that yields will rise to around 3.5 per cent by 2017.
Longview Economics focuses on equities and asks: how long will the Western secular bull market last? Its answer, to give away the punchline, is about two years. It makes its own calculation on what is fair value for shares and plots to what extent shares have been above or below fair value. You can see in the bottom graph the result, with bands shown at one standard deviation and two standard deviations above and below it. As you can see, this indicator has been signalling a "buy" since August last year and remains in buy territory.
Both studies are really just a form of discipline: an effort to set present market valuations into some kind of historical context. You can say that markets are never "wrong", in the sense that they simply reflect the balance of hopes and fears of investors at any one moment in time. But if you look at both those graphs you can see that prices do spend considerable periods of time deviating sharply from a norm, more so in the case of equities than bonds.
There is no magic about a standard deviation: it is simply a measure of variance of any set of data, with one standard deviation being the square root of its variance. If the data has a typical form, say the classic bell-curve, you would expect numbers to be within one standard deviation either side of the mean for a little more than two-thirds of the time. So when prices are outside those bands you could say that you have a buy or a sell signal.
Of course, markets may spend a long time deviating from the centre point of their distribution. Apply the buy/sell rule to equities over the past 40 years and you would have spent the period from 2000 to 2008 outside the market. While that with hindsight would not have been a bad idea, you would probably have re-entered the market too early. But when someone said to me in March 2009 that they thought this was a once-in-a-generation opportunity to get into shares, you can see from the chart that this turned out to be a pretty accurate judgement.
None of this is more than the most general of guides for investment strategy. It does not at all explain what has been happening in bond markets, which do look a bit of an aberration. Anyone investing in equities can take some comfort from the data, but it is perfectly possible to construct other valuation models that give a more negative signal.
My point is the simple one that it is possible to explain why shares are doing pretty well, notwithstanding the sombre flow of economic information. The really big questions are what will happen when the central banks stop printing the money. When will they start to pull back? What will they do with the stock of public debt they hold? What are the inflationary consequences? And what are the specific implications for the eurozone? But the answers to those are many months away.
Subscribe to Independent Premium to bookmark this article
Want to bookmark your favourite articles and stories to read or reference later? Start your Independent Premium subscription today.
Join our commenting forum
Join thought-provoking conversations, follow other Independent readers and see their replies