Bottom of the class: UK literacy and numeracy standards slip down international rankings
Half a million 15-year-olds were tested in 65 countries - and we were 26th in maths and 23rd in reading

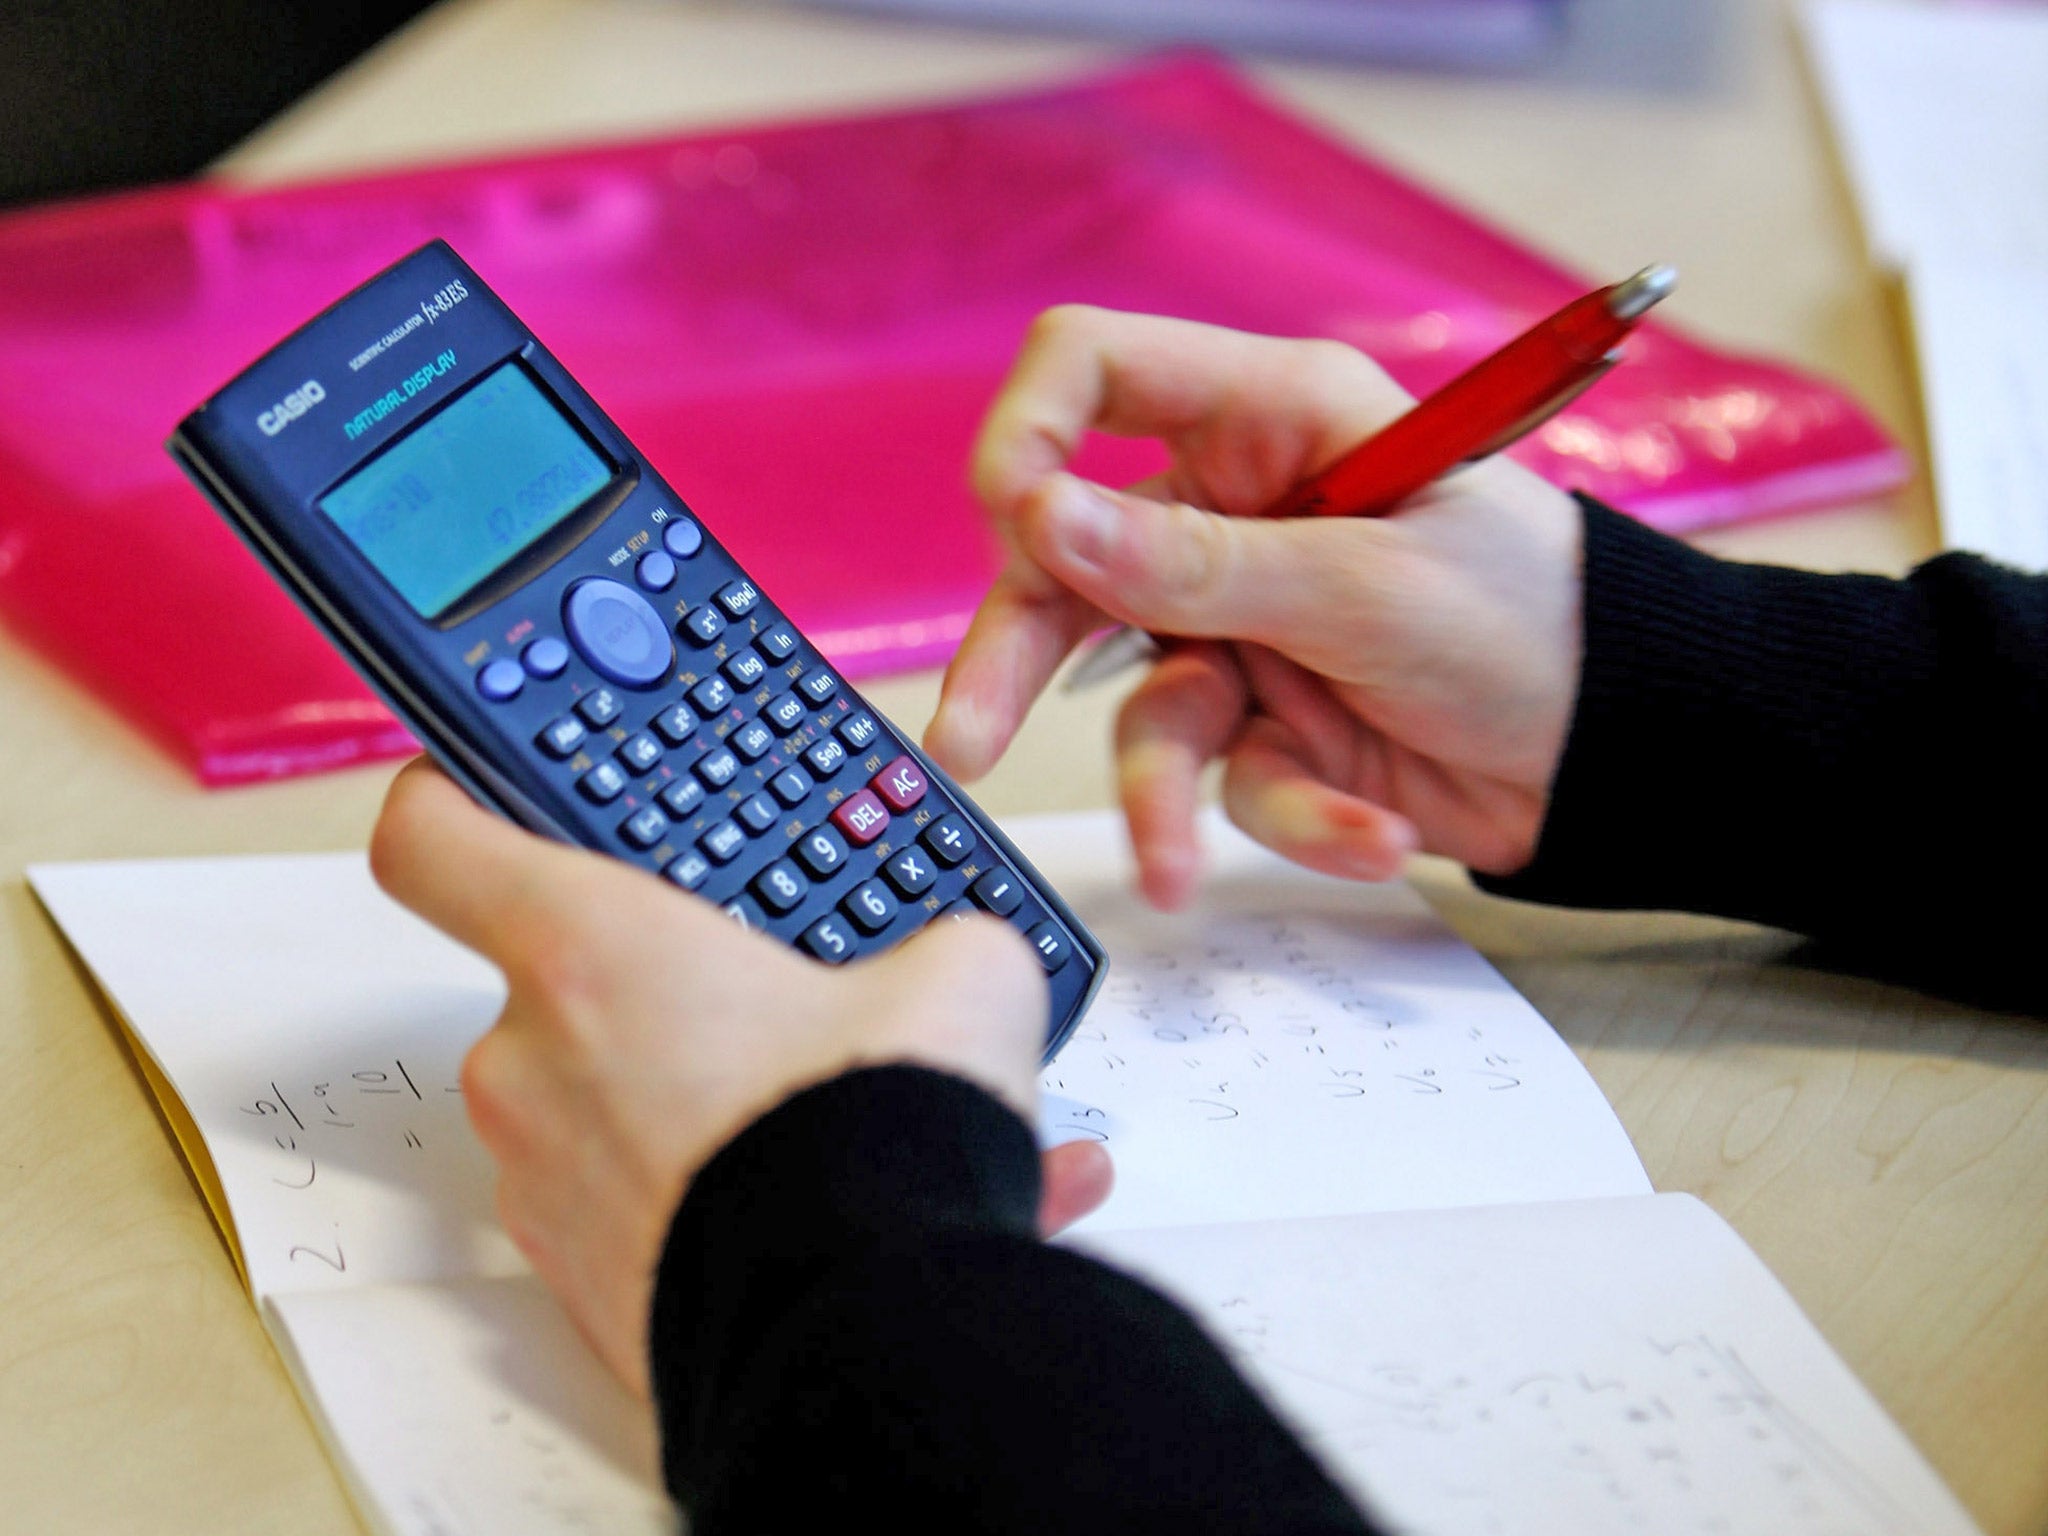
Literacy and numeracy standards in the UK have shown no improvement at all in the last three years with the result that our 15-year-olds are now three years behind those in the world’s best education system - Shanghai in China - in maths.
This is the conclusion of the 2012 PISA tests - of 15-year-olds in 65 different countries in maths, reading and science - which also appear to show that pumping far more resources into education, as the UK has done, has failed to pay off.
The figures show that the UK is 26th in maths out of 65 countries, 23rd in reading and 20th in science - remarkably similar positions to those in the last tests in 2009 when we were 27th, 26th and 20th respectively.
Reasons for the failure to improve cited in the report include not targeting spending effectively. It also points out that those countries which head the league tables target getting the best qualified teachers into deprived areas more strongly.
Also, the report echoes earlier OECD findings that the current generation of young people in the UK are not so skilled in maths and reading as their grandparents’ generation.
The results immediately triggered a kind of ping-pong war between Education Secretary Michael Gove and his Labour counterpart Tristram Hunt with Mr Gove claiming the stagnation was nothing to do with his policies and all Labour’s fault while his Labour counterpart Tristram Hunt accused the Coalition Government of “failing to confront the international challenge we face”.
So who’s right? Is Mr Gove correct in claiming the figures show “the last government failed to secure the improvements in school standards our young people desperately need”.
He certainly has powerful backing for one claim - that they are not a verdict on his own government’s reforms. No less a person that Andreas Schleicher, deputy director of the OECD - who organised the tests, said: “You could not possibly judge them (the reforms) on these results. You are moving from idea to implementation. 2015 would be the earliest.”
They also appear to vindicate Mr Gove’s reforms of the exam system - particularly GCSEs - by pointing the finger at grade inflation for the year on year rises in the pass rate while maths (and reading) standards were stalling.
As Professor Robert Coe, an expert on assessment at Durham University, put it: “This seems to underline the view that improvements in GCSEs and some other examinations have had more to do with grade inflation than real sustained improvements over time.”

On education spending, it indicates that the billions spent on education under Labour have not been as effective as less money shelled out in other countries has been.
The table shows the UK spending the equivalent of $98,023 per head on six to 15-year-olds compared with an OECD average of $83, 382. Similarly in terms of the Gross Domestic project per capita the UK’s $35, 299 compares with an average of $33,732.
South Korea, one of the highest performing OECD countries in maths, spent well below the international average while the biggest spender was the United States ($115,000) whose performance level was exactly the same as Slovenia which spent $53,000.
It is also worth noting the comments of Professor Sir Michael Barber, Labour’s education guru in the Blair years and now chief education adviser to Pearson, who admitted in a frank lecture delivered last month that Labour had taken its eye off the ball of improving literacy and numeracy in its latter years of government.
“We had a really good run for a while but we didn’t sufficiently see it through.”
So should we ignore Tristram Hunt’s claim that the report is a “big wake-up call” for the Coalition Government?
“Eastern dominance centres on the importance that these high performing education systems place on the quality and status of the teaching profession as the central lever for driving up standards.” he added. “This report exposes the failings of this Government’s schools policy: a policy that has sent unqualified teachers into the classroom and prevented effective collaboration between schools.”
Academics were claiming on Tuesday that criticism should be widened to cover incentives given to the best teachers to work in schools in deprived areas. Mr Gove says his plans to allow headteachers to set their own pay scales will help achieve this - but teachers’ leaders argue there may not be enough in the school budget to do this effectively. Also, there is of course nothing to stop heads in the leafy suburbs offering higher pay to woo staff as well.
The approach in Shanghai is more sophisticated. As Mr Schleicher put it: “If you are a vice-principal of a great school in Shanghai and you want to become principal, you can get there, but only if you show that you can turn around one of the lowest-performing schools beforehand.”
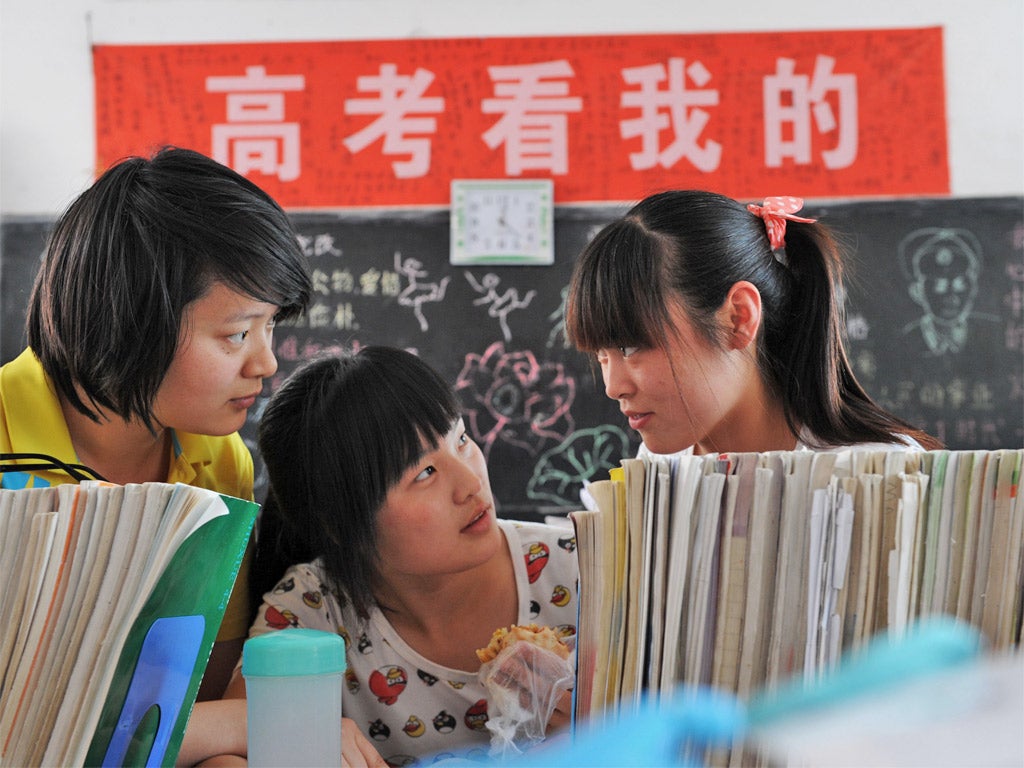
He also doused criticism of the eastern Asian countries by insisting their approach was not all about “drilling”. In Shanghai in particular it was all about seizing upon a child’s creativity and galvanising them to perform better. The result was that the city’s children were on average seven years ahead in maths of those in the worst performing education system - Peru - and three years ahead of average performers like the UK. It was true, though, that students in Korea – one of the top performing countries said they “hated” school. In addition, the use of private tutors to top up school teaching in eastern Asia is rife.
There was also a school of thought surfacing on Tuesday that you can place too much emphasis on PISA test results and overegg the interpretation of them. Moving from 27th to 26th in maths and 25th to 23 in reading in three years was not necessarily, to mirror the phraseology of Craig Revel Horwood in Strictly Come Dancing, a “dis-AAS -ter, darling.”
Harvey Goldstein, Professor of Social Statistics at Bristol University, said: “Michael Gove claims that England’s mediocre ranking is the fault of Labour education policies to which current 15-year-olds were subjected and Tristram Hunt claims that the results show England needs to emulate high ranking countries such as Singapore. In reality, both interpretations are fallacious.”
The chances that the PISA rankings will be ignored, though, are slim. Back to Sir Michael Barber: “The result (of introducing PISA tests) is that education ministers and officials around the world now engage in continuous dialogue about education reform. None can afford to ignore the mounting evidence of what works and what doesn’t.”
WHERE ENGLAND STANDS
Maths
1. Shanghai China 613
2. Singapore 573
3. Hong Kong 561
4. Chinese Taipei 560
5. Korea 554
6. Macao China 538
7. Japan 536
8. Liechtenstein 535
9. Switzerland 531
10. Netherlands 523
11. Estonia 521
12. Finland 519
13= Canada 518
= Poland
15. Belgium 515
16. Germany 514
17. Vietnam 511
18. Austria 506
19. Australia 504
20= Ireland 501
= Slovenia
22= Denmark 500
= New Zealand
24. Czech Republic 499
25. France. 495
26. UK 494
Reading
1. Shanghai China 574
2. Hong Kong 545
3. Singapore 542
4. Japan 538
5. Korea 536
6. Finland 524
7= Canada 523
= Chinese Taipei
= Ireland
10= Liechtenstein 516
= Estonia
12= New Zealand 512
= Australia
14. Netherlands 511
15= Macao China 509
= Switzerland
= Poland
19= Germany 508
= Vietnam
= Belgium
21. France 505
22. Norway 504
23. UK 499
Each of the tests were taken by pupils in 65 countries.
Join our commenting forum
Join thought-provoking conversations, follow other Independent readers and see their replies
Comments
Bookmark popover
Removed from bookmarks