Where are Covid infections rising in the UK? Top 20 hotspots
Infections and hospitalisations at their ‘highest level in months’ after ‘concerning’ rise, says UKHSA expert
Coronavirus cases are once again rising in the UK, with hospital infections in England having soared by more than a third in a week.
One in 65 people in England – equating to more than 850,000 people – are estimated to have had Covid-19 in the week ending 17 September, according to the latest Office for National Statistics (ONS) data.
This estimate was a rise from the previous week’s figure of one in 70 people – roughly 766,500 individuals, based on figures extrapolated from nose and throat swabs of a smaller group across the country. This compares to a summer peak of 3.1 million as a result of the BA.4 and BA.5 Omicron subvariants.
While the trend in Scotland and Northern Ireland is unclear, there is also believed to have been a rise in infections in Wales, where one in 50 people were thought to have the virus during that week.
In England, the percentage of people testing positive for Covid-19 increased in the North West, Yorkshire and the Humber, the West Midlands, the East of England, London, and the South East, while the trend was uncertain in all other English regions, the ONS said.
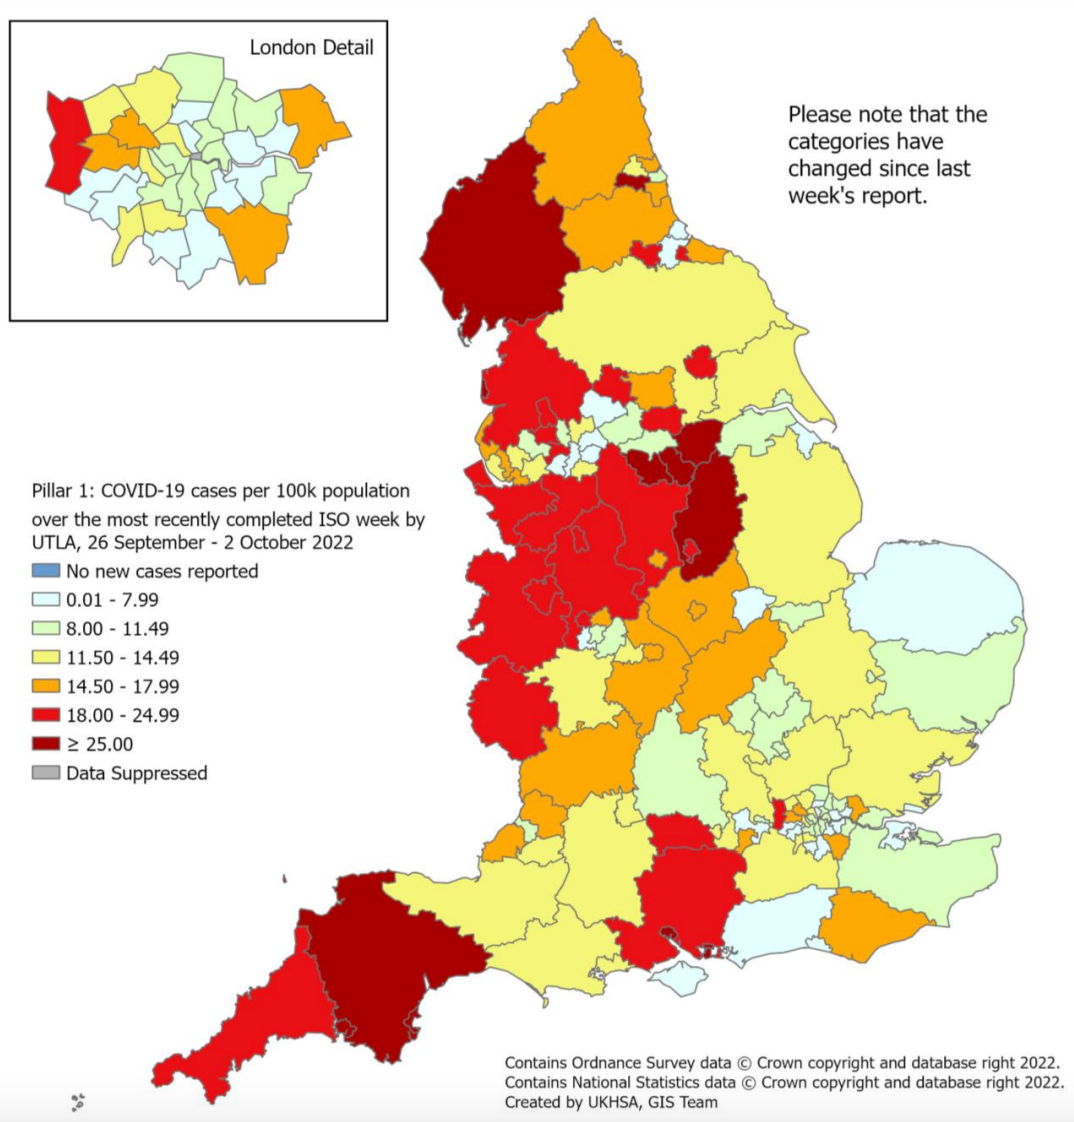
While it is considered less accurate as significantly fewer people test themselves for the virus and share their results with the government than at the height of the pandemic, official testing data from the UK Health Security Agency (UKHSA) suggests that the areas with the highest infection rates are geographically diverse.
Plymouth currently has the highest infection rate, according to UKHSA figures, with 143 per 100,000 people testing positive for the virus in the week to 1 October.
It was followed by Gateshead, North Somerset, the Isle of Wight, Northumberland, Dorset and York – which had infection rates ranging from 141 and 124 people per 100,000.
Meanwhile, the number of people with coronavirus in hospital in England hit 9,631 in the week to Wednesday, marking a 37 per cent increase upon the previous seven days and the highest figure in two months. The true number is likely higher as asymptomatic testing in NHS settings was paused from 31 August.
In the South West, hospital admission rates have soared by 250 per cent since mid-September, rising to 16 per 100,000 people in the most recent week.
The region currently has 1,003 patients who have tested positive, close to the peak seen this summer during the wave of infections driven by the Omicron BA.4 and BA.5 subvariants, which caused national hospital numbers to top 14,000 in mid-July.
The latest figures show all regions in England are recording a steady rise in patients, with three regions back to levels last seen in late July – however all remain considerably below those seen at the height of the pandemic.


The latest increases are “concerning” and cases and hospitalisation rates are at their “highest level in months”, said Dr Susan Hopkins, chief medical adviser at the UKHSA.
“Outbreaks in hospitals and care homes also on the rise,” Dr Hopkins added. “Make sure you have any Covid-19 vaccinations you are eligible for and avoid contact with others if you feel unwell or have symptoms of a respiratory infection.
“If you are unwell, it is particularly important to avoid contact with elderly people or those who are more likely to have severe disease because of their ongoing health conditions.”
Here are the 20 areas with the highest infection rates in the UK, according to testing data published by the UKHSA, relating to the week to 1 October:
Local authority | Number of cases | Infection rate (per 100,000 people)
- Plymouth – 376 – 143
- Gateshead – 286 – 141
- North Somerset – 282 – 130
- Isle of Wight – 182 – 127
- Northumberland – 413 – 127
- Dorset – 477 – 125
- York – 262 – 124
- East Riding of Yorkshire – 426 – 124
- Hampshire – 1,701 – 122
- Devon – 989 – 122
- Nottinghamshire – 1,009 – 121
- Stoke-on-Trent – 308 – 120
- Torbay – 162 – 118
- Doncaster – 372 – 118
- East Sussex – 660 – 118
- Cheshire East – 453 – 117
- Derbyshire – 943 – 116
- Southampton – 292 – 115
- Lincolnshire – 881 – 115
- Staffordshire – 1,009 – 114
Join our commenting forum
Join thought-provoking conversations, follow other Independent readers and see their replies
Comments
Bookmark popover
Removed from bookmarks