Hate crimes rise by up to 100 per cent across England and Wales, figures reveal
Spike in cases comes after The Independent reveals police are planning to increase protection for vulnerable groups
The number of hate crimes recorded by regional police forces rose by up to 100 per cent in the months following the Brexit vote, new figures show.
Dorset saw the greatest increase, with the 104 offences logged between July and September 2016 equating to double the total from April to June. Across England and Wales the rise was 27 per cent.
In total, 10 force areas saw rises of 50 per cent or more. Below we publish the full list.
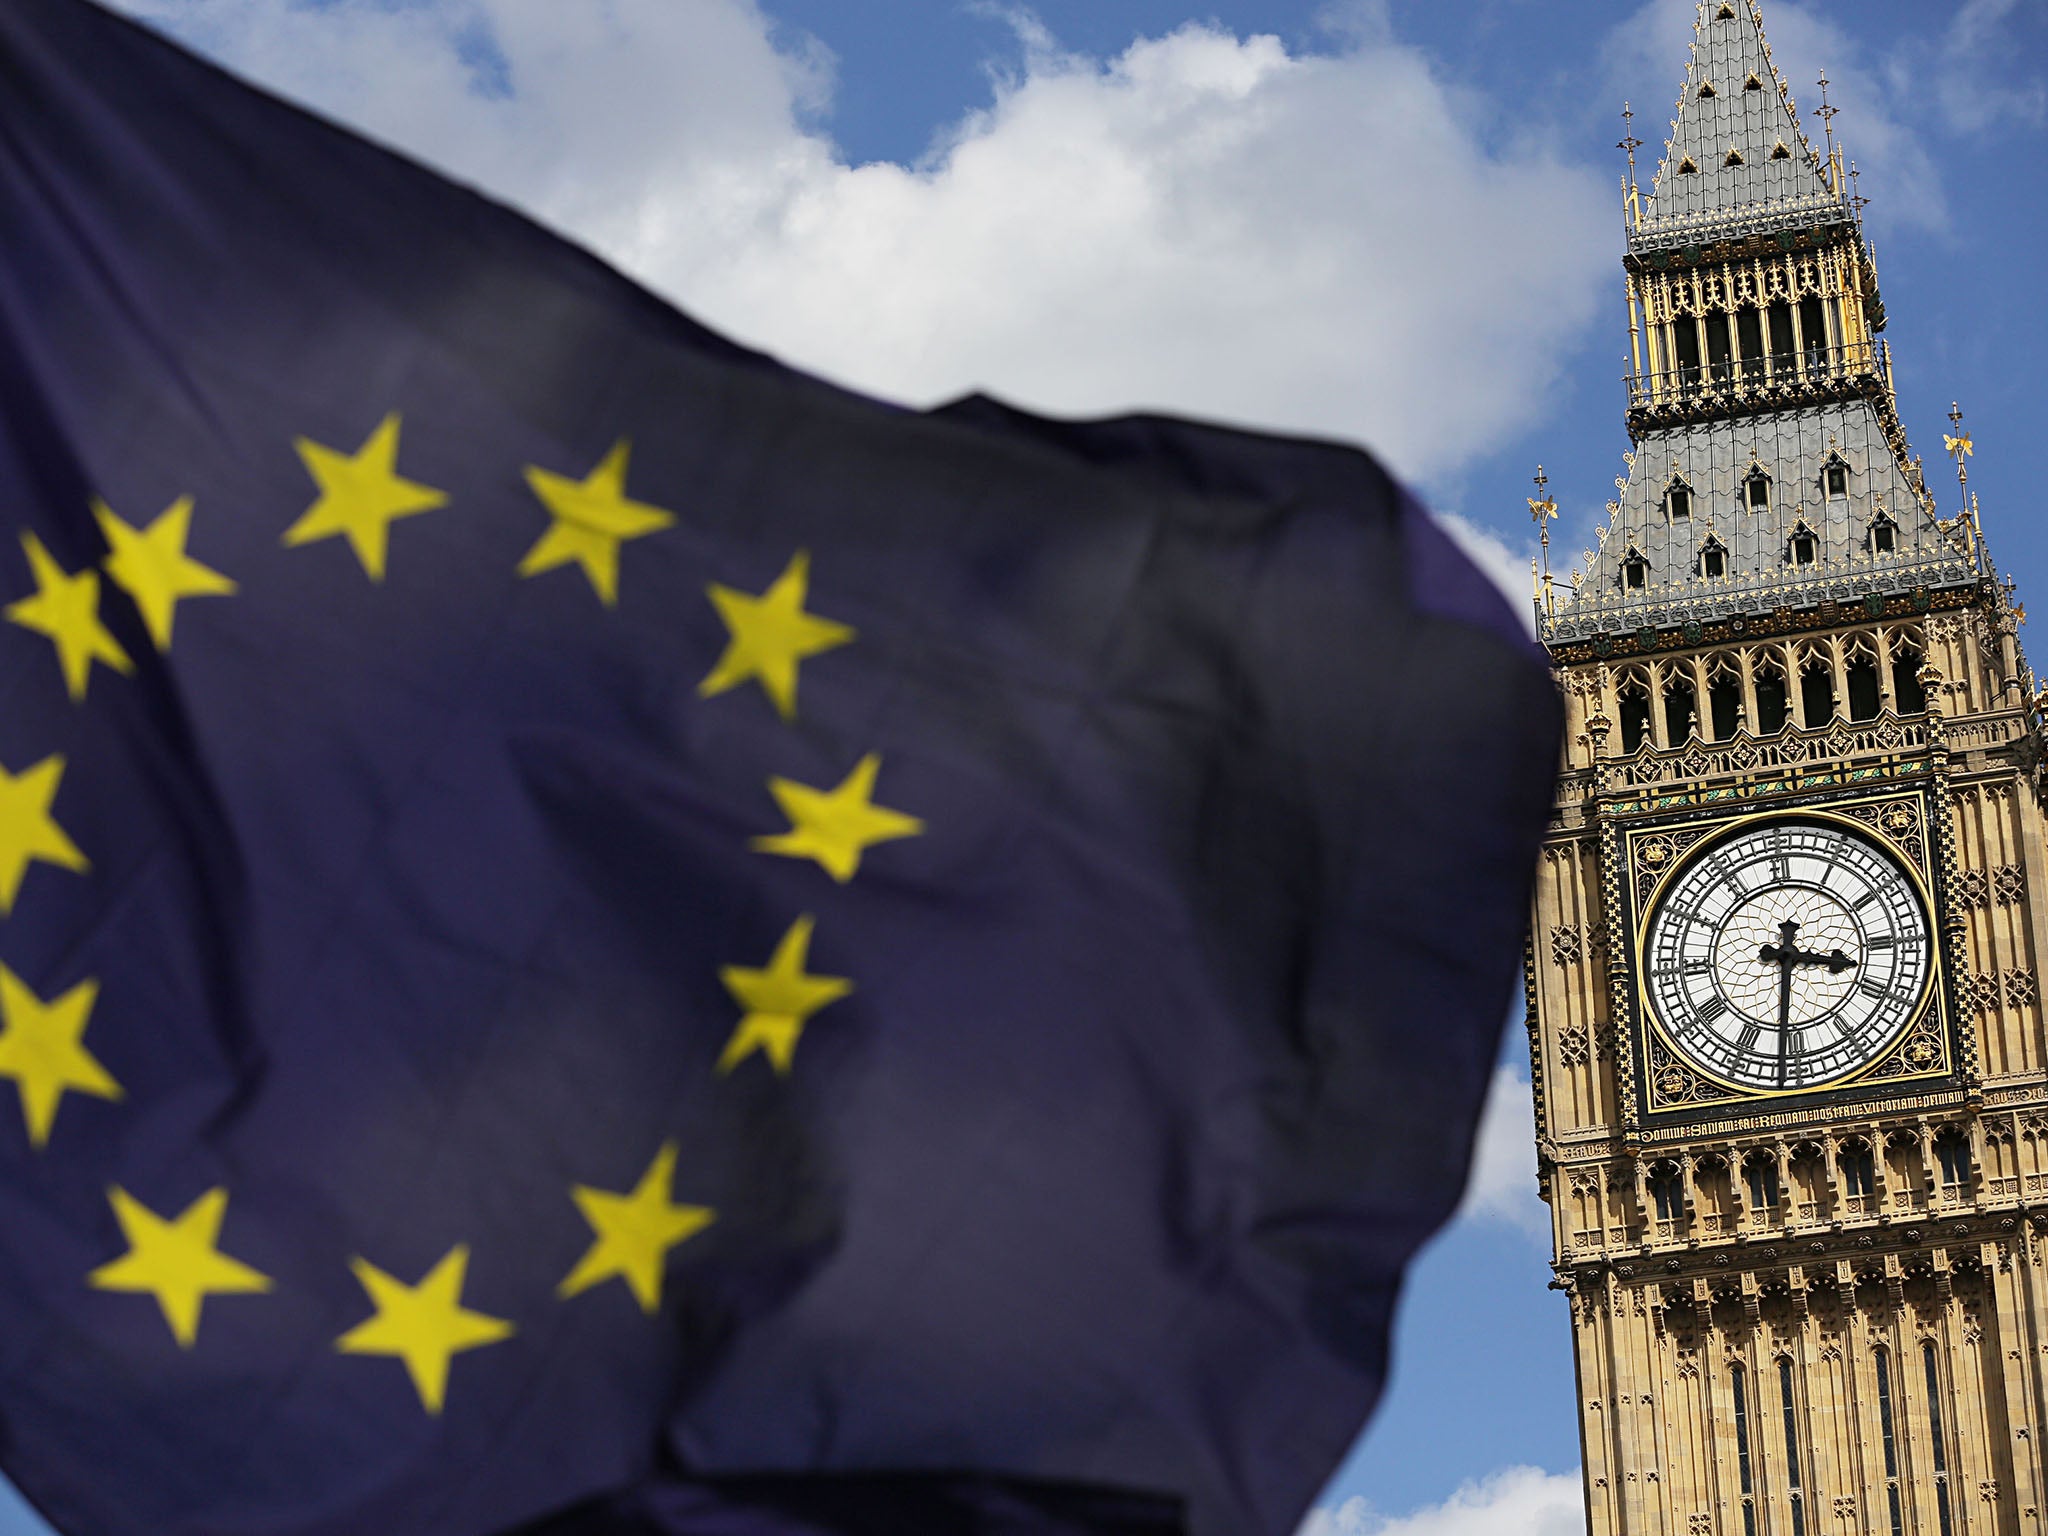
Police forces across the UK are ramping up intelligence gathering and putting protection in place for vulnerable communities ahead of a projected spike in hate crime when Theresa May triggers Article 50 next month.
The move follows a dramatic rise in the number of racially and religiously-motivated crimes reported to police following the June referendum result in favour of Brexit, including assaults and arson.
Community groups representing EU nationals in the UK have warned about the potential for an “undercurrent of xenophobia” to spread after the talks with Brussels get underway.
The head of the Equality and Human Rights Commission, David Isaac, has also said he is “hugely concerned” about a backlash against European citizens once the Government’s EU withdrawal negotiations begin.
Assistant Chief Constable Mark Hamilton, the National Police Chiefs’ Council lead for hate crime, said the organisation had been in touch with European embassies based in the UK over the threat of increased violence.
“We know that national and global events have the potential to trigger short-terms rises in hate crime and we saw this following the EU referendum last year,” he told The Independent.
Below are the number of hate crime offences recorded by police forces in England and Wales from July to September 2016.
They are ranked according to the size of the change compared with April to June last year, which is the figure shown in brackets.
An asterisk denotes that it was the highest quarterly figure since comparable records began in April 2012.
- Dorset 104* (up 100%)
- Nottinghamshire 189* (up 75%)
- North Yorkshire 64* (up 68%)
- West Mercia 247* (up 64%)
- Devon and Cornwall 220* (up 63%)
- Leicestershire 213* (up 60%)
- Kent 277* (up 60%)
- Lincolnshire 78* (up 59%)
- Humberside 140* (up 57%)
- Dyfed-Powys 35* (up 52%)
- Northumbria 394* (up 48%)
- West Yorkshire 1,013* (up 46%)
- Essex 376* (up 41%)
- Wiltshire 134* (up 38%)
- Suffolk 123* (up 37%)
- British Transport Police 620* (up 34%)
- Hampshire 463* (up 33%)
- Sussex 385* (up 32%)
- Hertfordshire 266* (up 30%)
- Cleveland 159* (up 29%)
- West Midlands 923* (up 27%)
- Norfolk 130* (up 25%)
- Gwent 77 (up 22%)
- North Wales 56 (up 22%)
- Lancashire 128 (up 21%)
- Metropolitan Police 3,356* (up 20%)
- Thames Valley 286* (up 20%)
- Avon and Somerset 449* (up 19%)
- Merseyside 477* (up 19%)
- Greater Manchester 1,033* (up 19%)
- Cheshire 195* (up 18%)
- Durham 66 (up 16%)
- Cumbria 50 (up 14%)
- South Wales 276* (up 10%)
- Cambridgeshire 179* (up 9%)
- Derbyshire 117 (up 8%)
- Staffordshire 237* (up 6%)
- Warwickshire 106* (up 6%)
- Bedfordshire 133* (up 6%)
- Northamptonshire 79 (up 4%)
- South Yorkshire 225 (down 1%)
- Gloucestershire 55 (down 4%)
- Surrey 137 (down 7%)
- City of London 25 (down 7%)
- Total: 14,295* (up 27%)
Police forces in England and Wales can class five types of racially or religiously aggravated offences as hate crimes: assault with injury; assault without injury; harassment; public fear, alarm or distress; and other criminal damage.
These categories are defined by statute, and have been used to compile the figures listed above, based on police force open data. Forces can decide to identify other types of offences as hate crimes, however, meaning the overall total could be higher.
Additional reporting by agencies
Join our commenting forum
Join thought-provoking conversations, follow other Independent readers and see their replies
Comments
Bookmark popover
Removed from bookmarks